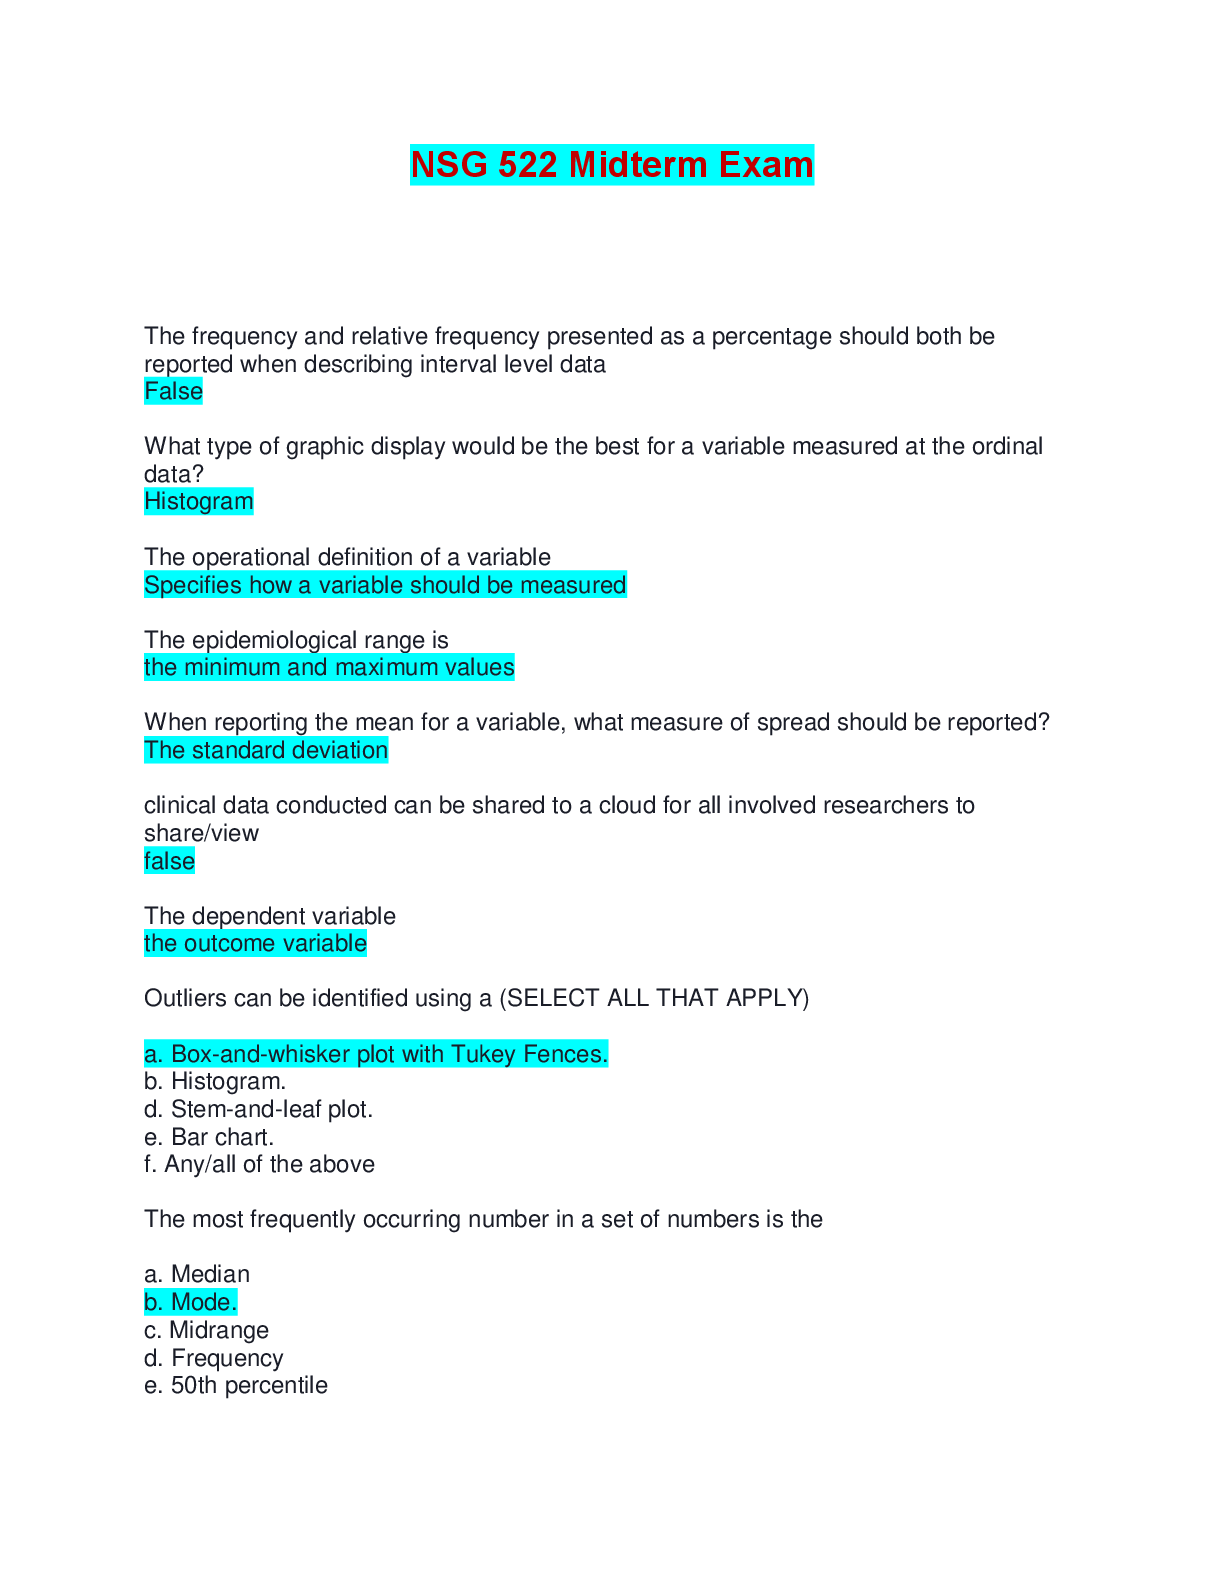
The frequency and relative frequency presented as a percentage should both be reported when describing interval level data
What type of graphic display would be the best for a variable measured at the ordinal data?
The
...
The frequency and relative frequency presented as a percentage should both be reported when describing interval level data
What type of graphic display would be the best for a variable measured at the ordinal data?
The operational definition of a variable
The epidemiological range is
When reporting the mean for a variable, what measure of spread should be reported?
clinical data conducted can be shared to a cloud for all involved researchers to share/view
The dependent variable
Outliers can be identified using a (SELECT ALL THAT APPLY)
a. Box-and-whisker plot with Tukey Fences.
b. Histogram.
d. Stem-and-leaf plot.
e. Bar chart.
f. Any/all of the above
The most frequently occurring number in a set of numbers is the
a. Median
b. Mode.
c. Midrange
d. Frequency
e. 50th percentile
The decision to use the mean or median is based upon (Select all that apply)
A. Whether the data are normally distributed
b. Which statistical tests will be used for hypothesis testing
c. The presence or absence of outliers
d. The guidelines of the journal where the data will be published
When a continuous variable has a normal distribution and only 1 small outlier, the mean and standard deviation should be used to describe the variable
Match the following variables to the correct level of measurement (A. Interval, B. Nominal, C. Ratio, D. Ordinal)
Temperature in Fahrenheit
Presence or Absence of disease
Weight in ounces
Race
Quality of life (1-5)
Hemoglobin A1C
Time in Minutes
Level of education
Oxygen Saturation
Blood type
A conceptual definition defines how a variable will be measured, and includes the equipment and procedures that are used in the measurement
Testing a new piece of equipment to ensure that the equipment consistently provides that same measurement when the same variable is measured multiple times is an example of
Accuracy
Validity
Reliability
All of the above
Bar charts and histograms can both be used to describe interval level data
All studies need appropriate permission to examine data
The mean is the number in the middle of the observations, when the observations are arranged from smallest to largest.
The best way to determine whether data are normally distributed is to
A. Construct a box and whisker plot with turkey fences
B. Construct a histogram
C. Perform a Shapiro-Wilk test
D. Perform a test for outliers
A study can only have one dependent variable
In a box and whisker plot, the length of the box is equal to the
Midrange
Epidemiological range
Statistical range
Interquartile range
The mean is the arithmetic average of the observations
What percentage of observations fall within +/- 2 standard deviations of the mean?
25%
50%
68%
95%
99%
The validity of a weight measurement obtained with an electronic scale refers to the repeatability of the measurement
The quality of life is measure on a scale of 1 (extremely poor quality) to 5 (best possible quality). The best graphic display of these measurements would be a
Bar chart
Stem and leaf plot
Box and whisker plot
Histogram
What percentage of scores fall between the first and third quartile?
25%
50%
68%
75%
100%
When analyzing the variable gender, which was measured in 5 categories- the data should be displayed using a
histogram
box and whisker plot
pie chart
bar chart
line chart
a variable was coded as disease present, disease not present, or disease status unknown. When performing the descriptive statistics, which of the following should be used? SELECT ALL THAT APPLY
Median
Percentages
Proportions
Frequencies
Mode
A student conducting a quality improvement project on a unit in the university hospital where the student is enrolled. Since the project is required by the university, the student does not need to obtain additional permission for the project
False
Height recorded in centimeters should be displayed using. SELECT ALL THAT APPLY
Bar chart
Box and whisker plot
Stem and leaf plot
Histogram
If a hypothesis test identifies a statistically significant finding, that means that the finding is clinically significant and should be implemented into clinical practice as soon as possible
A sample is...
A. Selected from the population of interest using a random process
B. Best selected by using a nonprobability sampling method
C. A subset of the population of interest
D. Best selected by using a purposive sampling
Which of the following p-values is/are statistically significant when alpha is set at 0.05? SELECT ALL THAT APPLY
0.0Q0
0.410
0.999
0.100
0.500
A small sample size
A. Increases the risk of both type 1 and type 2 errors
B. Has no effect on the results of a statistical test
C. Increases the risk of a type 2 error
D. Increases the risk of a type 1 error
the 95% confidence interval for the mean of a set of observations indicates that 95% of the observations fall within the confidence interval
A researcher determines that the results of a hypothesis test are statistically significant. This means that the p-value from the test is
>.05
<.025 or >.975
>.95
<.05
Sample size influences the ability of a hypothesis test to detect statistically significant differences
A clinical nurse leader on the surgical intensive care unit compares two interventions for reducing the number of SSI's. A statistical test comparing the number of infections in each group yields p-value of .049. This value indicates that
A. There is a statistically significant difference between the groups
B. There is a risk of type 2 error
C. There is not a statistically significant difference between the groups
D. There is not enough information presented to interpret the findings.
A type 2 error occurs when the researcher concludes that there is a statistically significant difference between the groups when there really is no difference
Differences between the characteristics of a sample and the characteristics of the population of interest are due
Sampling error
Random error
Measurement error
Systematic error
When alpha is set at .05, only p-value of <.05 or >.95 are statistically significant
A nurse researcher compares two interventions for preventing CAUTI in an academic medical center. A statistical test comparing the number of infections in the two groups yields a p-value of 0.10. This p-value means that.
A. There is a statistically significant difference between the two groups.
B. A larger sample is needed to determine statistical significance
C. The difference is clinically but not statistically significant
D. There is not a statistically significant difference between the groups
Which of the following samples would provide the best representation of a population
A. A nonprobability sample
B. A quota sample
C. A simple random sample
D. A convenience sample
When performing a hypothesis test to compare groups, a type 1 error is made when a researcher
A. Rejects the alternative hypothesis
B. Concludes that there is a significant difference between groups when there really is not a difference
C. Accepts the null hypothesis
D. Concludes that there is not a statistically significant difference when there really is a difference
When performing a hypothesis test, a type 2 error occurs when the researcher incorrectly
A. Accepts the alternative hypothesis
B. Concludes that the findings are not statistically significant
C. Rejects the null hypothesis
D. Concludes that the findings are statistically significant
A 95% confidence interval for a mean indicates
A. 95% of the observations are located within the interval
B. there is a 95% chance that the finding is statistically significant
C. We can be 95% confident that the true population mean lies within the interval
D. All of the above
Nonprobability samples are selected using a random process
Which of the following sampling methods would provide the best representation of a population with the following racial composition: 68% white, 15% African American, 12% Hispanic, 5% Asian
Cluster sample
Simple random sample
Quota sample
Stratified random sample
A 95% confidence interval for the mean of a set of height measurement is 62.9 and 64.5 inches. This finding means that
A. There is a 5% chance of a type 1 error
B. We can be 95% confident that the true populations mean is between 62.9 and 64.5 inches
C. The confidence interval is not statistically significant
D. 95% of the observations in the data set are between 62.9 and 64.5 inches.
The standard error of the mean is a measure of the spread of observations around the mean of the observations
Which of the following are probability samples? SELECT ALL THAT APPLY
Cluster Sample
Stratified random sample
Quota sample
Convenience sample
Systematic sample
When alpha is set at .05, that means that
A. There is a 95% chance of making a type 2 error
B. Only p-values >.05 are statistically significant
C. There is a 5% chance of making a type 1 error
D. There is a 5% chance of incorrectly accepting the null hypothesis
The null hypothesis always stats that there is no relationship between the variables or differences between the groups
A clinical nurse specialist is comparing two post op pain management strategies to determine whether there is a difference between the 2 strategies in cost of care, length of hospital stay, and patient satisfaction with care. Which of the following is/are dependent variables in this study?
Satisfaction with care
Cost of care
Pain management strategy
Clinical Nurse Specialist
Length of hospital stay
An analysis of variance results in p-value of 0.50. The researcher should conclude that
A. There is a statistically significant difference between the groups.
B. The results are clinically significant
C. There is not a statistically significant difference between the groups
D. The sample size was too small
A p-value 0.50 from a Spearman Correlation Coefficient would indicate that there is
A. A strong relationship between the variables
B. Not a statistically significant relationship between the variables
C. A moderate, positive relationship between the variables
D. A statistically significant relationship between the variables
Which of the following are parametric test? SELECT ALL THAT APPLY
Repeated measures ANOVA
Paired t-test
McNemar Test
Pearson correlation coefficient
Wilcoxon signed-rank test
When comparing hemoglobin A1C measurements that re normally distributed with no outliers in 2 independent groups, the researcher should use which of the following?
Fisher exact
Pearson correlation
independent t test
Kruskal-Wallis ANOVA
The interpretation of a p-value varies depends on what statistical test was used to obtain the p-value
Which of the following can be determined from a Spearman correlation coefficient and its associated with p-value? SELECT ALL THAT APPLY
Statistical significance
Risk of a type 2 error
Strength of the relationship
Direction of the relationship
Which of the following are nonparametric tests? SELECT ALL THAT APPLY
Chi Square test
Dependent t test
Spearman correlation coefficient
One-way analysis of variance
Mann-Whitney test
A researcher studies the relationship between hours of television watching and BMI. The correlation coefficient is .35 which indicates
A moderate inverse relationship
A weak positive relationship
A strong positive relationship
A moderate positive relationship
Which of the following would be reasons for using a nonparametric test? SELECT ALL THAT APPLY
interval level data
Shapiro-wilk test p-value of 0.010
Presence of one small outlier
Normal distribution
Nominal level data
Pearson correlation coefficient can be positive or negative
The best test to use when testing for a relationship between 2 dichotomous, independent variables would be a
McNemar Test
Chi-square test
Independent t-test
Fisher Exact test
When comparing ratio level variable that is normally distributed and without outliers in 3 different groups of patients, which statistical test should be used
Kruskal-Wallis ANOVA
Friedman test
Chi-square test
One-way ANOVA
A Pearson correlation coefficient is 0.04. This correlation indicates that there is
A statistically significant relationship between the variables
A moderate, positive relationship between the variables
A strong relationship between the variables
A very weak relationship between the variables
A researcher is comparing the outcome variable of cost in US dollars in 3 independent groups. The data are normally distributed without outliers. The researcher should use which of the following tests to compare 3 groups?
Chi-square test
One-way ANOVA
Kruskal-Wallis test
Friedman test
Repeated measures ANOVA
A researcher studies the relationship between the number of minutes of breast pumping and the amount of milk produced per day in mothers of preterm infants. The R-squared value is 0.49. This finding means that
There is not a statistically significant relationship between the variables
There is a moderate positive relationship between the variables
The number of minutes of pumping explains 49% of the variance in milk output
There is not enough information to determine whether there is a meaningful relationship between the variables
Parametric tests can be used to analyze ordinal variables but not nominal variables
An R-value of 0.33 indicates
A moderate relationship between the variables
A statistically significant relationship between the variables
The null hypothesis should be rejected
There is no relationship between the variables
When comparing pain scores measured on a scale from 1-10 in the same patients before and after receiving a new pain medication, the researcher should use which of the following tests
A Mann Whitney test
A Wilcoxon signed-rank test
A McNamar test
A paired t test
P values vary from 0-1.0 and can be positive or negative
When testing for a relationship between 2 independent, nominal variables, the best test to use would be a/an
Independent t-test
Pearson correlation coefficient
Chi-square test
Spearman correlation coefficient
[Show More]
.png)


.png)
.png)


 (Q&A).png)
.png)
.png)
.png)
.png)
.png)
.png)
.png)
