Data Management Applications C170 with complete solution. Graded A+. 2022/2023.
Information Technology > EXAM > Verified Learners | Final Quiz | ISYE6501x Courseware | edX (answered) 2021/2022 (All)
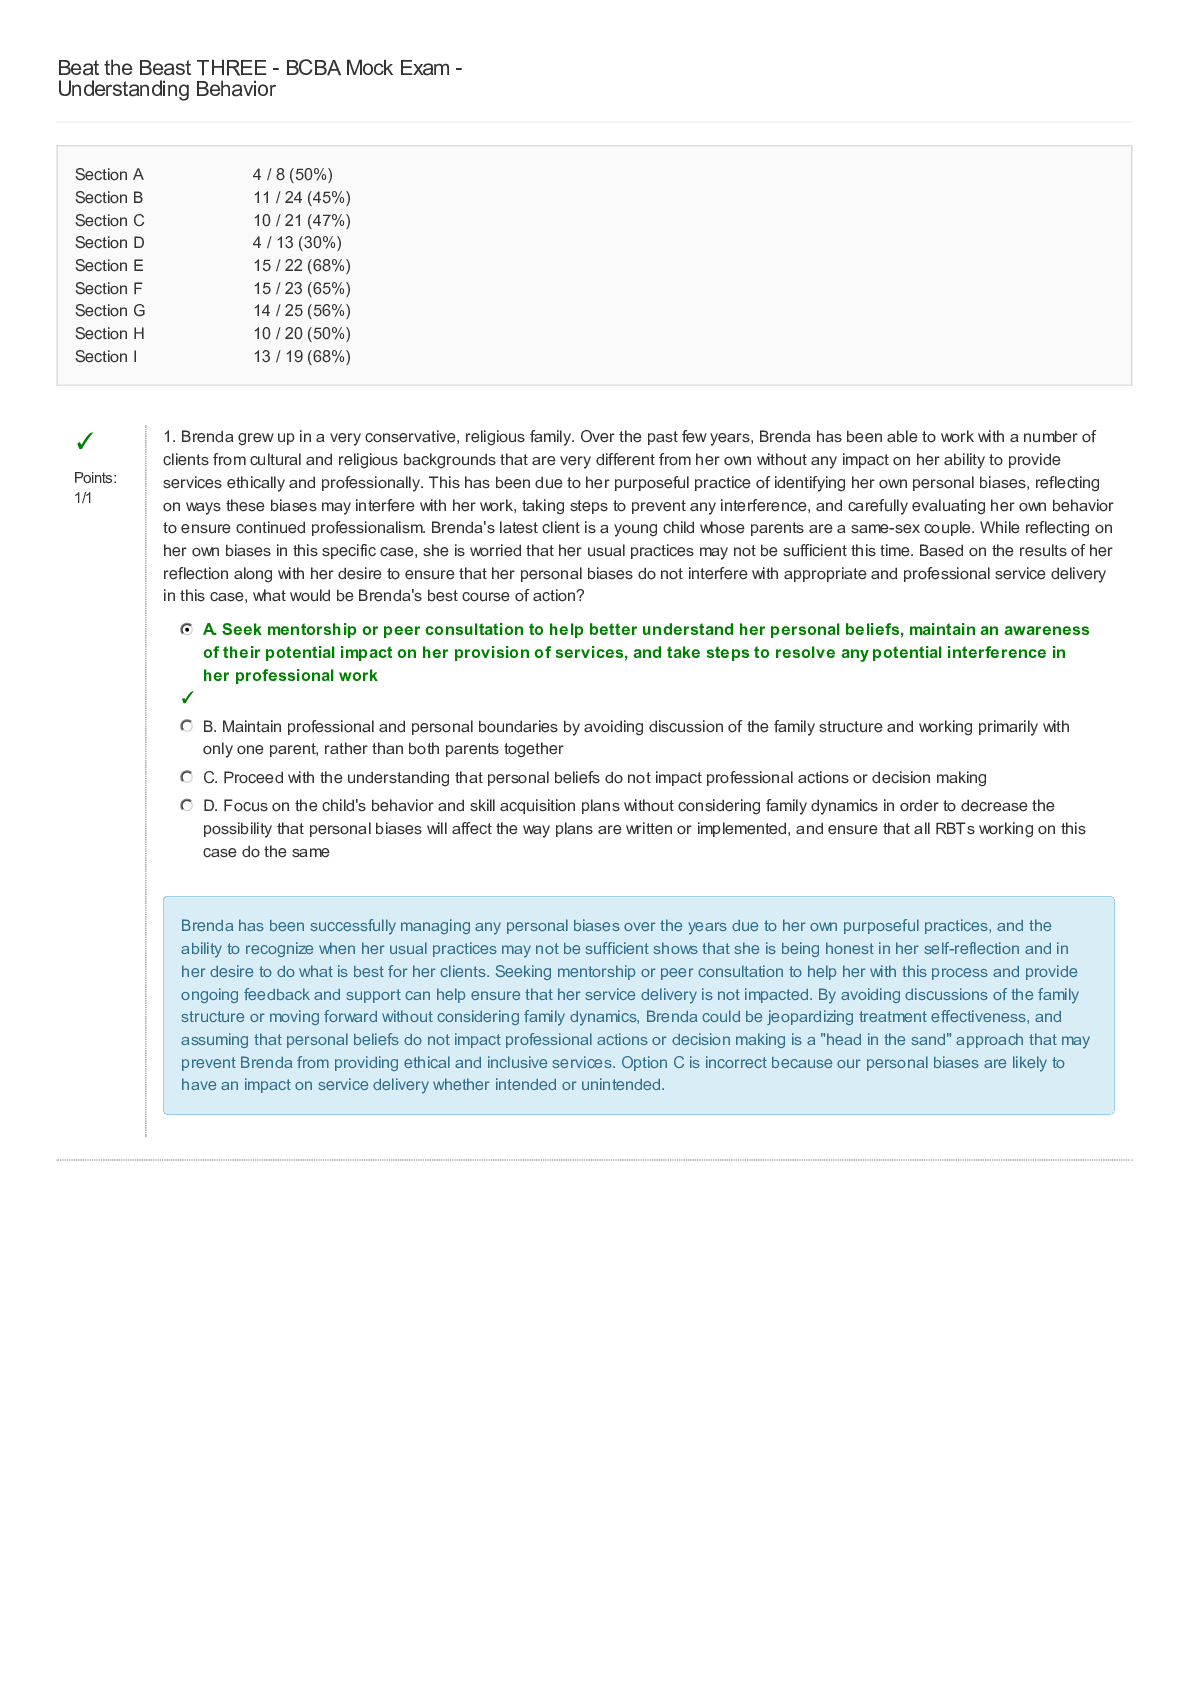
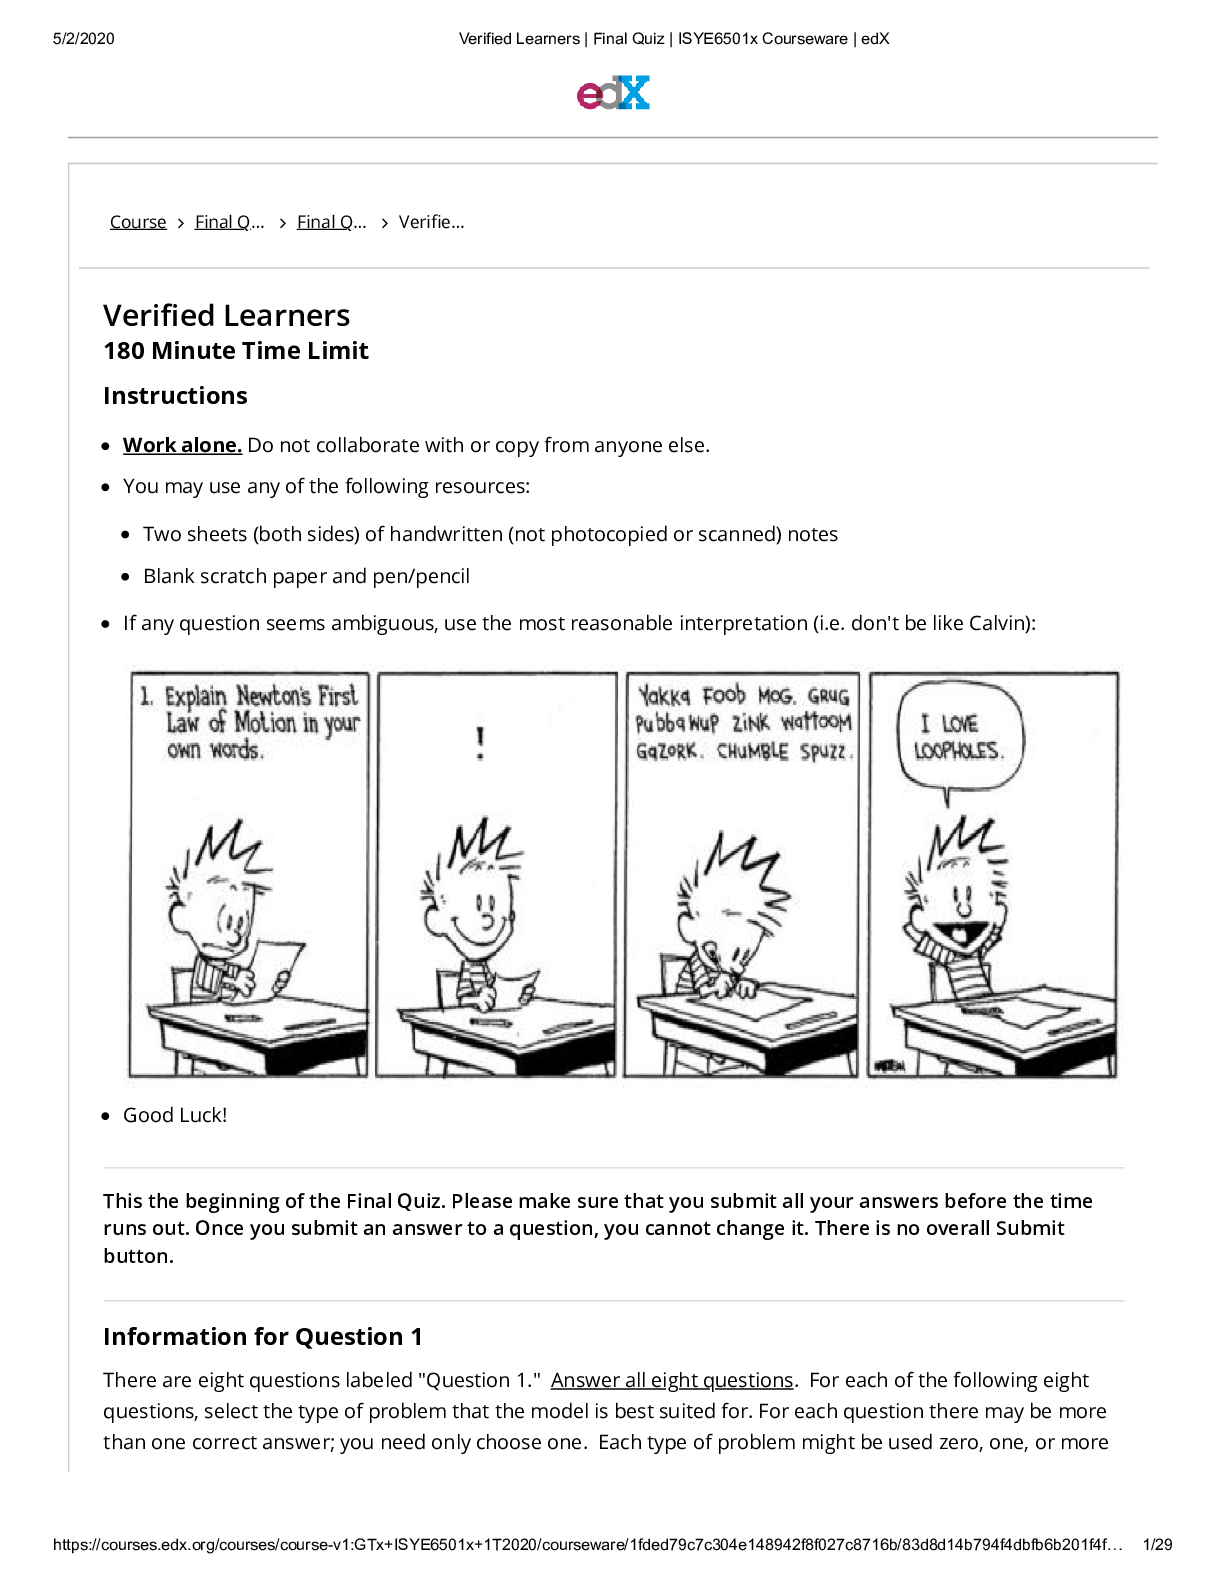
Verified Learners | Final Quiz | ISYE6501x Courseware | edX Information for Question 1 There are eight questions labeled "Question 1." Answer all eight questions. For each of the following eight qu ... estions, select the type of problem that the model is best suited for. For each question there may be more than one correct answer; you need only choose one. Each type of problem might be used zero, one, or more than one time in the eight questions. Question 1 0.0/0.5 points (graded) Select the type of problem that stepwise regression is best suited for. There may be more than one correct answer; you need only choose one. You have used 1 of 1 attempt Question 1 0.0/0.5 points (graded) Select the type of problem that k-nearest-neighbor is best suited for. There may be more than one correct answer; you need only choose one. ClassiÕcation Clustering Experimental design Prediction from feature data Prediction from time-series data Variable selection ClassiÕcation Clustering Experimental design Prediction from feature data Prediction from time-series data You have used 1 of 1 attempt Question 1 0.5/0.5 points (graded) Select the type of problem that logistic regression is best suited for. There may be more than one correct answer; you need only choose one. You have used 1 of 1 attempt Question 1 0.5/0.5 points (graded) Select the type of problem that ARIMA is best suited for. There may be more than one correct answer; you need only choose one. Variable selection ClassiÕcation Clustering Experimental design Prediction from feature data Prediction from time-series data Variable selection You have used 1 of 1 attempt Question 1 0.5/0.5 points (graded) Select the type of problem that k-means is best suited for. There may be more than one correct answer; you need only choose one. You have used 1 of 1 attempt Question 1 0.5/0.5 points (graded) Select the type of problem that a support vector machine is best suited for. There may be more than one correct answer; you need only choose one. Prediction from feature data Prediction from time-series data Variable selection ClassiÕcation Clustering Experimental design Prediction from feature data Prediction from time-series data Variable selection You have used 1 of 1 attempt Question 1 0.5/0.5 points (graded) Select the type of problem that linear regression is best suited for. There may be more than one correct answer; you need only choose one. You have used 1 of 1 attempt Question 1 0.5/0.5 points (graded) Select the type of problem that GARCH is best suited for. There may be more than one correct answer; you need only choose one. Clustering Experimental design Prediction from feature data Prediction from time-series data Variable selection ClassiÕcation Clustering Experimental design Prediction from feature data Prediction from time-series data Variable selection You have used 1 of 1 attempt Information for Question 2 There are eight questions labeled "Question 2." Answer all eight questions. For each of the following eight questions, select the type of analysis that the model is best suited for. For each question there may be more than one correct answer; you need only choose one. Each type of analysis might be used zero, one, or more than one time in the eight questions. Question 2 0.625/0.625 points (graded) Select the type of analysis that k-nearest-neighbor classiÕcation is best suited for. There may be more than one correct answer; you need only choose one. ClassiÕcation Clustering Experimental design Prediction from feature data Prediction from time-series data Variable selection Question 2 0.625/0.625 points (graded) Select the type of analysis that a support vector machine is best suited for. There may be more than one correct answer; you need only choose one. You have used 1 of 1 attempt Question 2 0.625/0.625 points (graded) Select the type of analysis that a k-nearest-neighbor classiÕcation tree is best suited for. There may be more than one correct answer; you need only choose one. You have used 1 of 1 attempt Question 2 0.0/0.625 points (graded) Select the type of analysis that a linear regression tree is best suited for. There may be more than one correct answer; you need only choose one. You have used 1 of 1 attempt Question 2 0.625/0.625 points (graded) Select the type of analysis that a logistic regression tree is best suited for. There may be more than one correct answer; you need only choose one. Question 2 0.0/0.625 points (graded) Select the type of analysis that a random linear regression forest is best suited for. There may be more than one correct answer; you need only choose one. You have used 1 of 1 attempt Question 2 0.625/0.625 points (graded) Select the type of analysis that linear regression is best suited for. There may be more than one correct answer; you need only choose one. You have used 1 of 1 attempt Question 2 0.625/0.625 points (graded) Select the type of analysis that a random support vector machine forest is best suited for. There may be more than one correct answer; you need only choose one. You have used 1 of 1 attempt Question 3 3.0/4.0 points (graded) Select all of the following that are examples of time-series data. You have used 1 of 1 attempt Question 4 1.0/4.0 points (graded) Using feature data to predict the amount of something two time periods in the future Using feature data to predict the probability of something happening two time periods in the future Using feature data to predict the whether or not something will happen two time periods in the future Using time-series data to predict the amount of something two time periods in the future Using time-series data to predict the variance of something two time periods in the future Fraction of used cars sold for $5000 or more, in each of the last 20 years. Information about a used car (age, miles driven, color, whether it has 4-wheel-drive, etc.) that might aàect its sale price. Number of days each used car was on the market before being sold, for all used cars oàered for sale in the last 20 years. Number of used car sales each year for the last 20 years. Select all of the following reasons that data should not be scaled until point outliers are removed. You have used 1 of 1 attempt Question 5 3.0/4.0 points (graded) Select all of the following situations in which using a variable selection approach like lasso or stepwise regression would be important. You have used 1 of 1 attempt Information for Question 6 There are four questions labeled "Question 6." Answer all four questions. For each of the following four questions, select the type of model that the software package is best suited for analyzing. Each type of model might be used zero, one, or more than one time in the four questions. Question 6 0.0/1.0 point (graded) Which type of model is ARENA best suited for? Point outliers would appear to be valid data if not removed before scaling. Valid data would appear to be outliers if data is scaled Õrst. If data is scaled Õrst, the range of data after outliers are removed will be narrower than intended. If data is scaled Õrst, the range of data after outliers are removed will be wider than intended. Time-series data is being used. There are fewer data points than variables. There are too few data points to avoid overÕtting if all variables are included. It is too costly to create a model with a large number of variables. Linear regression You have used 1 of 1 attempt Question 6 0.0/1.0 point (graded) Which type of model is SimPy best suited for? Linear regression You have used 1 of 1 attempt Question 6 1.0/1.0 point (graded) Which type of model is PuLP best suited for? Linear programming (optimization) You have used 1 of 1 attempt Question 6 0.0/1.0 point (graded) Which type of model is R best suited for? Discrete-event simulation You have used 1 of 1 attempt Question 7 6/7 points (graded) Keyboard Help For each of the analytics tasks listed below, drag to it the R function(s) that do it. If there is a function that does not do any of the tasks below, then don't drag it anywhere; all other functions should be used. Question 8 2.0100000000000002/3.0 points (graded) The following process was followed to predict sales of a product each month for the next three years: 1. Split past sales data randomly into three sets: training, validation, and test. 2. Build 20 diàerent models using the training data. FEEDBACK Correctly placed 11 items. Did not place 2 required items. Good work! You have completed this drag and drop problem. Final attempt was used, highest score is 6.0 You have used 1 of 1 attempts. Show Answer 3. Evaluate all 20 models on the validation data. 4. Select the model that performed best on the validation data. 5. Evaluate the selected model on the test data. 6. Use the selected model to predict monthly sales for the next three years based on real-time data, and observe its true performance. Select all of the following that are true. You have used 1 of 1 attempt Question 9 2.0/4.0 points (graded) A positive correlation has been observed between number of police and amount of crime reported (where there are more police per capita more crime is reported, and where more crime is reported there are more police per capita). Based on that observed correlation, select all of the following statements about the direction of causality between police and crime reports that are true. Every model's expected performance on training data will be the same as its expected performance on the validation data, because both the training data and the validation data are taken from the same population. The selected model's expected performance on test data will be worse than its expected performance on the validation data, because there is a selection bias: the selected model is more likely to have inÖated performance due to randomness. The selected model's expected performance on test data must be better than its observed performance on real-time data, because the training data and test data were taken from the same population, but the real-time data might be diàerent. Police cause crime reports: Where more police are working, citizens report more crime to them. Crime reports cause police: Where there is more crime reported, more police are hired to stop it. Both more police and more crime reports are positively correlated with another factor, which causes both. Can't tell without more analysis. You have used 1 of 1 attempt Question 10 2.0/4.0 points (graded) Select all of the following situations where including a "data missing" binary variable is probably better than imputing missing data. You have used 1 of 1 attempt Information for Question 11 There are four questions labeled "Question 11." Answer all four questions. For each of the following four questions, select the model that is more directly appropriate. Assume you have a relevant set of predictor data to use. Each type of model might be used zero, one, or more than one time in the four questions. Question 11 1.0/1.0 point (graded) Which model is more directly appropriate to estimate the probability that a tennis match will be sold out (all seats will be purchased)? Logistic regression You have used 1 of 1 attempt Question 11 50% of the data points have missing values for this variable, and you believe that points with missing data have a diàerent distribution of values from points where data is present. 50% of the data points have missing values for this variable, and you cannot build a good predictive model for the missing data. 2% of the data points have missing values, and you cannot build a good predictive model for the missing data. 2% of the data points have missing values, and you can build a good predictive model for the missing data. Which model is more directly appropriate to estimate the likelihood that a speciÕc apple tree will produce more than 30 apples this year? Logistic regression You have used 1 of 1 attempt Question 11 1.0/1.0 point (graded) Which model is more directly appropriate to estimate the amount of fuel that will be used by a delivery truck in one day of deliveries in Atlanta? Linear regression You have used 1 of 1 attempt Question 11 1.0/1.0 point (graded) Which model is more directly appropriate to forecast the number of hot dogs that will be sold at a baseball game? Linear regression You have used 1 of 1 attempt Question 12 3.0/3.0 points (graded) Select all of the following situations where a supervised learning model (like classiÕcation) is more directly appropriate than an unsupervised learning model (like clustering). You have used 1 of 1 attempt Question 13 2.68/4.0 points (graded) A hospital has collected data on how long hip replacement surgery patients have required before regaining nearly-full motion without pain, as well as attributes of each patient (age, height, weight, pre-surgery range of motion, other medical conditions, etc.). Now, the hospital wants to use that data to predict recovery time for a new patient. Select all of the following situations where a linear regression model is more directly appropriate than a classiÕcation model. You have used 1 of 1 attempt Information for Question 14 There are four questions labeled "Question 14." Answer all four questions. For each of the following four questions, select the model that is more directly appropriate. Assume you have a relevant set of predictor data to use. Each type of model might be used zero, one, or more than one time in the four questions. Question 14 1.0/1.0 point (graded) Given estimates of the cost to renovate each of a set of houses available for purchase, the estimated purchase price of each, the estimated revenue from selling the renovated houses, and restrictions on combinations of houses that can be purchased (not too many in the same neighborhood, not too many of the same style, etc.), Õnd the set of houses that an investor should purchase, renovate, and sell to maximize the expected proÕt. Which model is more directly appropriate? Optimization You have used 1 of 1 attempt The hospital wants to estimate the amount of time it will take for the new patient to regain nearly-full motion without pain. The hospital wants to predict whether or not the new patient will regain nearly-full motion without pain in six months or less. The hospital wants to predict whether or not the new patient will regain nearly-full motion without pain in six months or less, if he loses 10 pounds (4.5kg) before the surgery. Question 14 1.0/1.0 point (graded) Given the distributions of manufacturing time at each of 100 steps of a manufacturing process, and the probability of requiring rework at each of the steps, estimate the distribution of the time it will take to produce 10,000 unites of a product. Which model is more directly appropriate? Simulation You have used 1 of 1 attempt Question 14 1.0/1.0 point (graded) Given the weights and volumes of various pieces of oil drilling equipment, and the capacities and costs of using diàerent types of aircraft to ship them, Õnd the minimum-cost shipping plan to move a large set of drilling equipment from one oil Õeld to another. Which model is more directly appropriate? Optimization You have used 1 of 1 attempt Question 14 1.0/1.0 point (graded) Given the expected performance of thousands of stocks, and to covariances between them, Õnd an investment portfolio with the best mix of expected return and low risk. Which model is more directly appropriate? Optimization You have used 1 of 1 attempt Questions 15a-f 11.4/18.0 points (graded) A large trial law Õrm would like to increase the fraction of cases it wins by doing a better job of assigning cases to its lawyers. If you're an expert in the legal industry, please do not rely on your expertise to Õll in all that extra complexity (you'll end up making the questions more complex than I intended). Currently, cases are assigned based on workload. When a new case comes in, the Õrm assigns it to whichever lawyer has the lowest current workload among the subset of lawyers qualiÕed to handle the case. The current approach sometimes leads to the law Õrm losing a case it could've won, because lawyers are sometimes assigned to cases that they're minimally qualiÕed for but aren't in their primary area of expertise. This happens because the minimally-qualiÕed lawyer has the lowest current workload, while a more-qualiÕed lawyer who is more likely to win the case has a slightly higher workload (but would still be able to take on this case). Instead, the law Õrm's managing director would like to start using analytics to determine which lawyer to assign to each new case. a. Select all of the models/approaches the practice could use to predict the probability that a certain lawyer will win a speciÕc case, based on characteristics of this case, characteristics of the lawyer's previous cases, and whether the lawyer won or lost each previous case. Suppose the law Õrm begins assigning cases to whichever lawyer has the highest probability of winning, from among all lawyers whose case loads are not full. Once the law Õrm starts using probability-based case assignment, they begin winning a higher fraction of cases. As a result, they believe they will start getting more business (more cases coming in). b. Select all of the models/approaches the practice could use to determine whether or not there has been a change in the rate of cases coming in. Discrete-event simulation GARCH k-means Linear regression Logistic regression CUSUM Louvain algorithm Optimization Queuing c. Select all of the models/approaches the practice could use to predict how many new cases will come to the Õrm each month, based on the number of cases that have come in during past months, in a way that can adapt over time as the situation changes. Over time, lawyers' probabilities of winning cases could improve, as they get more experience. Suppose that two years after implementing probability-based case assignment, the law Õrm wants to determine whether the probabilities they estimated two years earlier (before probability-based assignment) are diàerent two years later (after implementing probability-based assignment). d. Select all of the models/approaches the practice could use to determine whether there has been a bigenough change in probabilities that they should re-Õt the model in part a. on more-recent data. Random logistic regression forest ARIMA Elastic net Exponential smoothing Stochastic optimization Support vector machine A/B testing using each case as an observation and whether it is won or lost as the response CUSUM on the diàerences between each lawyer's fraction of cases won before and after probabilitybased case assignment was implemented Exponential smoothing, to see whether the seasonal factors are diàerent before and after probabilitybased case assignment was implemented Simply compare a lawyer's fraction of cases won before and after implementing probability-based case assignment, and see if they're the same or diàerent Use the same method as in part a., and see if that model's new output is signiÕcantly diàerent from what it was before Another approach to part d. would be to use the binomial distribution: treat cases before implementation as one distribution and cases after implementation as another, and see whether the observed win probability p is signiÕcantly diàerent. The Õrm could use these signiÕcance tests to determine which lawyers were improving their skills and which were not. e. Select all of the reasons that this would not be a good approach to use. Suppose a new lawyer joins the Õrm right after graduating from law school, so there is no data on this lawyer's probability of winning diàerent types of cases. f. Select all of the models/approaches the practice could use to estimate win probabilities for this new lawyer until enough data is collected. A lawyer might be assigned to diàerent types of cases before implementation than after implementation, so it's not a good comparison. The geometric distribution would be more appropriate than the binomial distribution to answer this question. A non-parametric test is required to compare the average (mean) win percentages. As the law Õrm wins a higher fraction of its cases, it might be presented with more-diÞcult cases than before. Under the new system, lawyers are more likely to be assigned to cases that they're more likely to win, so on average we might expect lawyers' observed win probabilities to increase. Bayesian analysis, with an initial baseline distribution for each type of case being updated as each of the lawyer's cases provides a new data point Logistic regression to predict the new lawyer's win probability based on characteristics of the lawyer and of other lawyers in the Õrm, and the other lawyers' win probabilities when they started Markov chain, with the states being the number of cases the lawyer has won so far Multi-armed bandit, with the diàerent case types being assigned to the lawyer more or less likely based on data as it's collected Simulation, using other lawyers' win probabilities as the new lawyer's probability of winning each type of case 5/2/2020 Verified Learners | Final Quiz | ISYE6501x Courseware | edX https://courses.edx.org/courses/course-v1:GTx+ISYE6501x+1T2020/courseware/1fded79c7c304e148942f8f027c8716b/83d8d14b794f4dbfb6b201f… 22/29 You have used 1 of 1 attempt Information for Questions 16a,b Figure 2. Confusion matrix (Sensitivity 96.7%, SpeciÕcity 84.5%) A support vector machine model has been created to predict whether a person is right-handed or left-handed, based on the person's genetic proÕle. The Õgure above shows a confusion matrix of the model's performance on a test data set that it was not trained on. More Information for Question 16a There are four questions labeled "Question 16a." Answer all four questions. For each of the following four questions, select the calculation that is most appropriate to support or refute the statement. Each calculation might be used zero, one, or more than one time in the four questions. Question 16a 1.0/1.0 point (graded) Which calculation is most appropriate to support or refute the statement "If someone is right-handed, then the model is very likely to predict the person to be right-handed"? 5412/(5412+991) = 84.5% You have used 1 of 1 attempt Question 16a 1.0/1.0 point (graded) Which calculation is most appropriate to support or refute the statement "If someone is left-handed, then the model is very likely to predict the person to be left-handed"? 948/(948+32) = 96.7% You have used 1 of 1 attempt Question 16a 1.0/1.0 point (graded) Which calculation is most appropriate to support or refute the statement "If the model predicts someone to be left-handed, then the person is very likely to be left-handed"? 948/(948+991) = 48.9% You have used 1 of 1 attempt Question 16a 1.0/1.0 point (graded) Which calculation is most appropriate to support or refute the statement "If the model predicts someone to be right-handed, then the person is very likely to be right-handed"? 5412/(5412+32) = 99.4% You have used 1 of 1 attempt Question 16b 2.0/2.0 points (graded) Select all of the following ways that it is reasonable to use this model. You have used 1 of 1 attempt Questions 17abcde 7.8/12.0 points (graded) A very large (thousands of rooms) hotel in Las Vegas is planning to remodel its parking garage. There are lots of considerations and complexities that go into doing that, so this question will look at just a small part of it, with several simpliÕcations. If you're an expert in the construction or hotel industries, please do not rely on Use the model's classiÕcation when it predicts right-handedness, but remain undecided when it predicts left-handedness Use the model's classiÕcation when it predicts left-handedness, but remain undecided when it predicts right-handedness v1:GTx+ISYE6501x+1T2020/courseware/1fded79c7c304e148942f8f027c8716b/83d8d14b794f4dbfb6b201f… 24/29 your expertise to Õll in all that extra complexity (you'll end up making the questions more complicated than I intended). When remodeling the parking garage, the hotel wants to make sure that it is unlikely to run out of parking spaces even when all rooms are occupied, but given that restriction it also wants to make the parking garage as small as possible to save costs and space. The hotel would like to use analytics (analyzing its past ten years of data) to help determine the right number of parking spaces to have. A complicating factor is that the hotel doesn't have complete data; for about 2% of the hotel guests, the person at the front desk did not record whether the guest had a car or not. a. The hotel's director of facilities has come up with the following incorrect idea: GIVEN past attribute data of guests and whether they had a car, USE linear regression TO impute the missing data (whether guests had a car or not). Then, GIVEN the number of cars each day for the past ten years, USE exponential smoothing TO predict how many parking spaces will be needed each day for the next ten years. Finally, GIVEN the daily predictions of the number of parking spaces required, USE optimization TO determine the minimum number of parking spaces required so that 90% of the highest 10% of daily predictions will be less than or equal to the number of parking spaces. Select all of the statements below that show a reason why the director's idea is wrong. b. The director has come up with another incorrect idea: GIVEN past attribute data of guests and whether they had a car, USE a support vector machine (SVM) model TO impute the missing data (whether guests had a car or not). Then, GIVEN the average and standard deviation of the number of cars on each day, USE a normal distribution TO determine how many parking spaces are needed to be 99% sure that there will be enough spaces for the average number of cars plus normally-distributed randomness. Select all of the statements below that show a reason why the director's idea is wrong. Optimization isn't required to do what the director wants it to do. Linear regression is not an appropriate model to Õll in missing values for binary or probability data. Exponential smoothing is usually not appropriate for forecasting so many time periods ahead. There is too much missing data to use regression-based imputation in the way the director suggested. The number of cars each day depends on the number of hotel rooms occupied, the distribution of which could change in the future. There is too much missing data to use SVM-based imputation in the way the director suggested. 5/2/2020 Verified Learners | Final Quiz | ISYE6501x Courseware | edX https://courses.edx.org/courses/course-v1:GTx+ISYE6501x+1T2020/courseware/1fded79c7c304e148942f8f027c8716b/83d8d14b794f4dbfb6b201f… 25/29 c. Select all of the possible paths below that could reasonably lead to a good solution. d. Select a set of models from the list below, that the director can put together to determine how many parking spaces there should be. The daily number of cars might not be normally distributed. A support vector machine is not an appropriate model to Õll in missing values for binary data. Impute missing data. Then predict the demand for hotel rooms each day, and predict the fraction that will require a parking space each day. Finally, determine how many parking spaces are needed so that the hotel is unlikely to run out of spaces even when variability leads to higher demand than usual. Impute missing data. Then estimate the distribution of the fraction of hotel rooms that will be occupied, and the distribution of the fraction of occupied hotel rooms that require a parking space. Then, determine how many parking spaces are needed so that the hotel is unlikely to run out of spaces even when variability leads to higher demand than usual. Impute missing data. Then predict the number of parking spaces required each day, and analyze the variability in that estimate. Finally, determine how many parking spaces are needed so that the hotel is unlikely to run out of spaces even when variability leads to higher demand than usual. GIVEN past attribute data of guests and whether they had a car, USE simulation TO impute whether guests with missing data had a car. GIVEN past attribute data of guests and whether they had a car, USE a k-nearest-neighbor classiÕcation model TO impute whether guests with missing data had a car. GIVEN past data on the number of hotel rooms occupied and the number of parking spaces used, USE distribution Õtting TO determine the distribution of the fraction of occupied rooms that required a parking space, as a function of the number of rooms occupied. GIVEN past data on the number of hotel rooms occupied and the number of parking spaces used, USE linear regression TO determine the distribution of the fraction of occupied rooms that required a parking space, as a function of the number of rooms occupied. GIVEN the distribution of the fraction of occupied rooms that require a parking space, as a function of the number of rooms occupied, USE a Markov chain TO Õnd the minimum number of parking spaces required so that the hotel is 99% likely to have enough parking regardless of the number of rooms occupied. e. Select all of the following complexities that are not accounted for in any of the models in part d. You have used 1 of 1 attempt Questions 18a-d (graded) In the United States in 2016, there was a diàerence between men's and women's annual earnings: the median annual earnings among working women were about 20% lower than the median annual earnings among working men. a. Select all of the models that could be used to determine whether the inÖation-adjusted pay diàerence between men and women has decreased signiÕcantly over the past 20 years. GIVEN the distribution of the fraction of occupied rooms that require a parking space, as a function of the number of rooms occupied, USE stochastic optimization TO Õnd the minimum number of parking spaces required so that the hotel is 99% likely to have enough parking regardless of the number of rooms occupied. Hotel guests who choose to drive to Las Vegas might be more likely to come on days when prices are lower and the number of occupied rooms is lower. A trend toward larger cars might mean that the number of parking spaces in the lot would need to be reduced in the future, as each space would require more area. As Uber, Lyft, etc. make renting cars less common, the fraction of occupied rooms that require a parking space might change over time. Linear regression with each year as a predictor, using the diàerence between median inÖation-adjusted earnings of men and women as the response and the year as the predictor Logistic regression with each year as a predictor, using the diàerence between median inÖationadjusted earnings of men and women as the response and the year as the predictor CUSUM on the diàerence between median inÖation-adjusted earnings of men and women, with each year as a data point Exponential smoothing on the diàerence between median inÖaton-adjusted earnings of men and women, with each year as a data point 5/2/2020 Verified Learners | Final Quiz | ISYE6501x Courseware | edX https://courses.edx.org/courses/course-v1:GTx+ISYE6501x+1T2020/courseware/1fded79c7c304e148942f8f027c8716b/83d8d14b794f4dbfb6b201f… 27/29 In the United States in 2016, there was a diàerence between men's and women's rate of dying due to an accident at work: the fraction of working men who died on the job was about 11 times higher than the fraction of working women who died on the job. b. Select all of the appropriate uses of the binomial distribution to test whether the diàerence in death rates between working men and working women is statistically signiÕcant. Let N be the number of working men, N be the number of working women, and K and K be the number of men and women killed on the job. NOTE: In the answer choices below, a "yes" answer refers to what is usually called a "success" in the binomial distribution, but obviously a person being killed is not a "success" so I've used a diàerent term. One suggested explanation for both discrepancies is the diàerence between the distribution of jobs chosen (and for college students, the college majors chosen) by men and women, and that men work more hours per year on average than women in the same job. Other factors (age, marital status, child-rearing responsibilities, etc.) have also been suggested. To test whether discrepancies between men's and women's outcomes persist after all of these factors are accounted for, a researcher has suggested the following: for each job classiÕcation, Õnd 100 pairs of one man and one woman who have the same age, marital status, number of children, county of residence, hours worked per year, college major and college selectivity (if applicable), and then run a non-parametric statistical test to see if women's and men's income and/or death rate are still signiÕcantly diàerent. c. Which of the nonparametric tests that would be valid to use in such a study. [Do not spend time worrying about whether the study's setup provides a valid comparison. For the sake of this question, assume it does, and think about what nonparametric test could be used in that case.] m w m w Find the probability of Km or more "yes" answers from a binomial distribution with n=Nw and p=Kw/Nw. Find the probability of Km or more "yes" answers from a binomial distribution with n=Nm and p=Km/Nm. Find the probability of Kw or more "yes" answers from a binomial distribution with n=Nw and p=Kw/Nw. Find the probability of Kw or more "yes" answers from a binomial distribution with n=Nm and p=Km/Nm. McNemar's test Paired-sample signed rank test Two-sample unpaired rank test (Mann-Whitney) One-sample signed rank test d. Select all of the statements below that could be a causal relationship between being male or female, and the type of job chosen, based only on the information above and the timing involved. [For the purpose of this question, do not think about whether the statements are true; assume they are true (even if you don't believe them) and determine whether, if true, the statement shows a causal relationship.] Data for this question was taken from the United States Bureau of Labor Statistics (BLS) and http://iwpr.org/wp-content/uploads/2018/11/C474_IWPR-Still-a-Mans-Labor-Market-update-2018-1.pdf. These sorts of issues are important; if you have any thoughts about how we could use analytics to address them, please let me know! You have used 1 of 1 attempt Question 19 0 points possible (ungraded) Do you think that you or any of your fellow students in this course would be good TAs for the course in the future? If so, please enter name(s) or username(s) below. Question 20 -- no answer required Having a higher-paying, more-dangerous job makes someone more likely to be born male. The combination of inborn/instinctive and societally-induced factors make employers more likely to pay higher salaries for more-dangerous jobs. There is no inborn/instinctive diàerence between men and women, but (on average) society teaches girls at a young age to pursue careers that are lower-paying. There is not a societally-induced diàerence between men and women, but (on average) men are instinctively drawn to jobs that earn more money to support a family. There is not a societally-induced diàerence between men and women, but (on average) men are instinctively more risk-taking so they are drawn to more-dangerous jobs. [Show More]
Last updated: 3 years ago
Preview 1 out of 29 pages
Buy this document to get the full access instantly
Instant Download Access after purchase
Buy NowInstant download
We Accept:

Can't find what you want? Try our AI powered Search
Connected school, study & course
About the document
Uploaded On
Aug 04, 2021
Number of pages
29
Written in
All
This document has been written for:
Uploaded
Aug 04, 2021
Downloads
0
Views
112
Scholarfriends.com Online Platform by Browsegrades Inc. 651N South Broad St, Middletown DE. United States.
We're available through e-mail, Twitter, Facebook, and live chat.
FAQ
Questions? Leave a message!
Copyright © Scholarfriends · High quality services·