Statistics > EXAM > ST 311 Final Exam | Questions and Answers (Complete Solutions) (All)
ST 311 Final Exam | Questions and Answers (Complete Solutions)
Document Content and Description Below
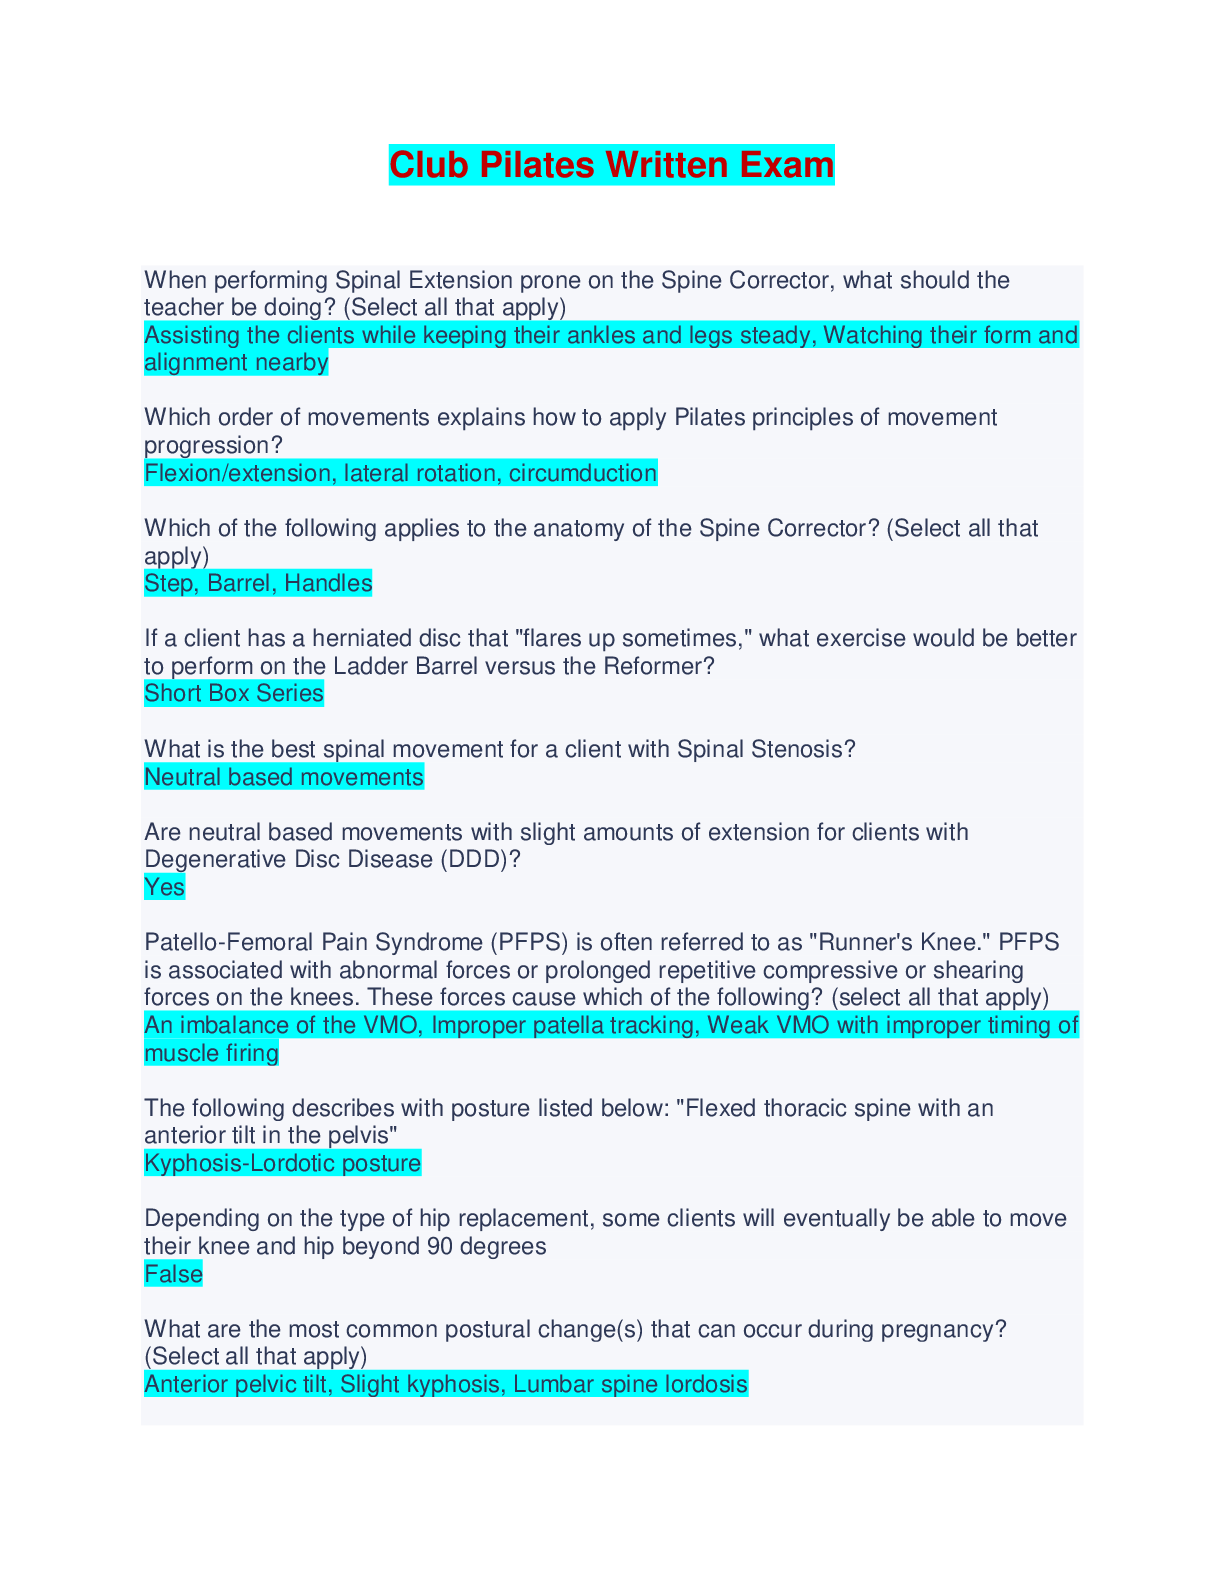
ST 311 Final Exam | Questions and Answers (Complete Solutions) A researcher was interested in utilities provided by city governments. The researcher randomly selected 20 counties from a list of all ... counties in the U.S. From each of these counties the researcher then contacted each city in those counties (a total of 192) and found that 12 (6.25%) of them provided electricity to their residents. Which of the following are true? Select all that apply. -The population of interest is all city governments in the U.S. -The population of interest is the 192 cities. -The population of interest is all city governments that provide utilities to their residents. -The population of interest is 6.25%. -The parameter of interest is the proportion of the city governments in the U.S. that provide electricity to their residents. -The parameter of interest is 6.25%. -The population of interest is the 20 counties. -The parameter of interest is the list of all counties in the U.S. A researcher was interested in utilities provided by city governments. The researcher randomly selected 20 counties from a list of all counties in the U.S. From each of these counties the researcher then contacted each city government (a total of 192) and found that 12 (6.25%) of them provided electricity to their residents. The type of sample used in this example is a -simple random sample. -cluster random sample. -stratified random sample. -none of the above. A professor wanted to determine the proportion of students in his class who have cheated on an exam. The professor selects a random sample of 30 students from his class and emails them the question "Have you ever cheated on an exam?". He receives responses from 10 of the 30 students. Which of the following statements are true? Select all that apply. -This study would suffer from undercoverage because the professor should have selected a sample from the entire student body of the university. -This study suffers from non-response bias because only 33% of the people surveyed provided a response. -This study suffers from response bias since students will not want to tell a professor whether or not they have cheated. -The study should not suffer from any bias since it was based on a random sample. An instructor in a college class recently gave an exam that was worth a total of 100 points. The instructor inadvertently made the exam harder than he had intended. The scores were very symmetric, but the average score for his students was 61 and the standard deviation of the scores was 3 points. The instructor is considering 2 different strategies for rescaling the exam results: Method 1:Multiply everyone's score by 1.2. Method 2:Add 9 points to everyone's score. Which of the following are true? Select all that apply. -Method 1 will increase the standard deviation of the students' scores -Method 1 will decrease the standard deviation of the students' scores. -Method 2 will decrease the standard deviation of the students' scores. -Method 2 will increase the standard deviation of the students' scores. A college professor stops at McDonald's every morning for 10 days to get a number 1 value meal costing $5.39. On the 11th day he orders a number 8 value meal costing $4.38. Which of the following are true? Select all that apply. -During the first 10 days the professor's standard deviation was more than 0. -During the first 10 days the professor's standard deviation was less than 0. -During the first 10 days, the professor's standard deviation was 0. -It is impossible to tell anything about the professor's standard deviation for the first 10 days. -Considering all 11 days, the professor's standard deviation was lower than the standard deviation of the first 10 days. -Considering all 11 days, the professor's standard deviation was higher than the standard deviation of the first 10 days. -Considering all 11 days, the professor's standard deviation was the same as the standard deviation of the first 10 days. -Considering all 11 days, It is impossible to tell anything about the professor's standard deviation compared to the first 10 days. After taking an aptitude test, the computer told Bob that he had a z-score of 1.08. If scores on the aptitude test are normally distributed, which of the following statements can Bob conclude from his score? Select all that apply. -Bob scored within 2 standard deviations of the mean score. -Bob did better than the mean score. -Bob scored within 1 standard deviation of the mean score. -Bob did worse than the mean score. -About 14% of students taking the aptitude test did better than Bob. -About 14% of students taking the aptitude test did worse than Bob. The Mental Development Index (MDI) of the Bayley Scales of Infant Development is a standardized measure used in longitudinal follow-up of high-risk infants. The scores on the MDI have approximately a normal distribution with a mean of 100 and standard deviation of 16. What proportion of children have MDI of at least 80? -0.8944 -0.7881 -0.2119 -0.1056 For a normal distribution, what standard score (Z-score) has 70% of the distribution above it? Find the closest value listed on the table. Give your answer to 2 decimal places. -0.52 Which of the following are NOT likely to be well modeled by a normal distribution because the distribution is NOT likely to be symmetric? (Hint: Sketch what you think the histogram would look like based on the information given.) Select one or more: -a. The scores from a university's mathematics placement exam in which the minimum score is 0 and the maximum score is 100. Although there were scores throughout the entire range, more than half of the students scored over 85. -b. The number of hours students at a large university work per week at outside jobs. More than 75% of the students worked less than 10 hours but about 5% had jobs in which they worked over 30 hours outside the university. -c. The height (in centimeters) of 10 year old boys in the U.S. Rarely are values lower than 120 cm or over 160 cm and the majority are between 135 cm and 145 cm. -d. The amounts of time people wait at a particular bus stop for the bus. About 60% of the time they wait less than 7 minutes, however, occasionally because of traffic issues they wait as long as 40 minutes. A state administered standardized reading exam is given to eighth grade students. The scores on this exam for all students statewide have a normal distribution with a mean of 517 and a standard deviation of 67. A local Junior High principal has decided to give an award to any student who scores in the top 10% of statewide scores. How high should a student score be to win this award? Give your answer to the nearest integer. 603 A researcher believes that the ankle circumference for adult males in Europe can be considered to have a normal distribution with a mean of 23 cm.If his belief is correct which of the following ranges of ankle sizes will have the largest proportion of members of this population? -14 to 20 cm -20 to 26 cm -26 to 32 cm -It is impossible to tell without the standard deviation. In a Midwestern state an automobile insurance company has a large number of customers. From company files it is known that 86% of the customers have only the state minimums for insurance. An official with the state board of insurance is going to take a random sample of 100 accounts to review. Find the standard deviation of the sample proportion in this situation. Give your answer to 4 decimal places .0347 The registrar of a large university knows that 30% of the students come to college with credit for an advance placement (AP) course. The registrar is going to conduct interviews with students regarding their experiences at the university. Depending on which students are chosen, the proportion of students in the sample that have AP credit may vary. (a) In a sample of 100 students, what is the probability that over 38% of the sample has AP credit? Give your answer to 4 decimal places. (b) In a sample of 200 students, what is the probability that over 32% of the sample has AP credit? Give your answer to 4 decimal places. (a).0401 (b).2676 According to a recent report it was found that 48.7% of residents in Franklin county Ohio are registered to vote. Which of the following is more likely. -We take a random sample of 30 people from this county and find that the proportion is less than 45% -We take a random sample of 50 people from this county and find that the proportion is less than 45% -We take a random sample of 100 people from this county and find that the proportion is less than 45% -We take a random sample of 500 people from this county and find that the proportion is less than 45% -We have no basis for predicting which is more likely to have an proportion less than 45% At a large university it is known that 45% of the students live on campus. The director of student life is going to take a random sample of 200 students. Which of the following is most likely to occur. -The sample proportion falls between 0.45 and 0.65 -The sample proportion falls between 0.25 and 0.45 -The sample proportion falls between 0.35 and 0.55 -The sample proportion falls between 0.4 and 0.5 At Appalachian State University it is known that 48% of undergraduates are male. If a sample of 125 undergraduate students was taken, which of the following would accurately describe the sampling distribution? Select all that apply. -The sampling distribution will be approximately normal -The sampling distribution will be skewed right. -The sampling distribution will be skewed left. -The mean of the sampling distribution will be equal to 50% -The mean of the sampling distribution will be equal to 48% -We cannot determine the mean of the sampling distribution from the given information. -The standard deviation of the sampling distribution will be 0.0447. -The standard deviation of the sampling distribution will be 0.0020. -The standard deviation of the sampling distribution will be 0.4996. -We cannot determine the standard deviation of the sampling distribution from the given information. Which of the following scenarios would it be appropriate to use normal approximation for the sampling distribution of the proportion? Select all that apply. -A researcher wishes to find the probability that less than 25% of a sample of undergraduate students from Winston Salem State University will be male. He randomly samples 42 undergraduate students from the student database. The population proportion of undergraduate males at WSSU is known to be 29.3%. -A researcher wishes to find the probability that more than 11% of a sample of undergraduate students from East Carolina State University will be between the ages of 25 and 34. He samples the first 105 students that walk into the gym on Monday morning. The population proportion of undergraduates between the ages of 25 and 34 is 9.9%. -A grad student at UNC Asheville wants to know how likely it is that a group of students would be made up of more than 5% graduate students. She will ask 40 of her friends if they are a graduate student or an undergraduate student. The population proportion of grad students at UNC Asheville is 1.3%. -A full time student at UNC Wilmington wants to know how likely it is that a group of students would be made up of more than 90% full time students. She will randomly ask 60 students their enrollment status. The population proportion of full time students at UNC Wilmington is 85%. np and nq must both be greater than 10 in order to make an inference from a sample, and they are not. A large company knows that 7% of their employees are paid sales commissions as part of their compensation. The director of human resources is going to take a random sample of 25 employees to complete a survey about compensation. What do we know about the shape of the sampling distribution of the sample proportion of employees who are paid commission? -It will be very close to a normal distribution with a mean of 0.07. -It will be somewhat skewed to the right. -It will be very close to a normal distribution with a mean of 0.50. -It will be distinctly bimodal with a peak at 7% and another at 93%. When engineers design products, it is important to consider the weights of people so that airplanes or elevators aren't overloaded. Based on data from the National Health Survey, we can assume the weight of adult males in the US has a mean weight of 197 pounds and standard deviation of 32 pounds. We randomly select 50 adult males. What is the probability that the average weight of these 50 adult males is over 189 pounds? Give your answer to 4 decimal places. 0.9616 In psychology, there is a particular Mental Development Index (MDI) used in the study of infants. The scores on the MDI have approximately a normal distribution with a mean of 100 and standard deviation of 16. We are going to randomly select 64 children and average their MDI scores. What is the probability that the average is under 103? Give your answer to 4 decimal places. .9332 A west-coast tech company knows the average age of its employees is 34 years. They also know that the standard deviation of the ages of these employees is 8 years. We know that the population of employee ages will have a right skewed distribution. A manager from human resources is going to randomly select a sample of 100. Which of the following is true? Select all that apply. -We know that the shape of the sampling distribution of the mean will be right skewed. -We know that the shape of the sampling distribution of the mean will be approximately symmetric. -We cannot tell what the shape sampling distribution of the mean will look like. -The sampling distribution of the mean will have a smaller standard deviation than the population. -The sampling distribution of the mean will have the same standard deviation as the population. -The sampling distribution of the mean will have a larger standard deviation than the population. According to the most recent census, the average income of households in Wake County is $58,500. It is also known that the distribution of household income in Wake County is strongly skewed to the right with a standard deviation of $14,000. A researcher is going to randomly select a sample of 5 households from Wake County. Which of the following is true? Select all that apply. -The sampling distribution of the mean will have a smaller standard deviation than the population. -We know that the shape of the sampling distribution of the mean will be right skewed. -The sampling distribution of the mean will have a larger standard deviation than the population. -We cannot tell what the shape sampling distribution of the mean will look like. -We know that the shape of the sampling distribution of the mean will be approximately symmetric. -The sampling distribution of the mean will have the same standard deviation as the population. At a large university it is known that 40% of the students live on campus. The director of student life is going to take a random sample of 200 students. What is the probability that more than half of the sampled students live on campus? Give your answer to 4 decimal places. .0019 In a specific, mid-size, warm-weathered city in southern California, there are 2 million homes. As part of an environmental status survey, it was desired to estimate the proportion of homes in this city which contain lead based paints. A simple random sample of 165 households revealed that 44 homes had lead based paints in at least one room. What is the sample proportion? Give your answer to 3 decimal places. .267 The CEO of a large corporation asked her head HR representative to take a random sample of 92 employees. From his sample, he finds that the proportion of their employees that have children is 0.73. What is the standard error of the proportion in this situation? Give your answer to 3 decimal places .046 A political action committee wanted to estimate the proportion of county residents who support the installation of red light cameras throughout the county. They took a random sample of 600county residents and found that the proportion who wanted to install these cameras was 33% with a margin of error of +/- 4% (with 95% confidence). This implies: -If we took another sample of 600 residents the sample proportion would definitely be between 29% and 37%. -If we take many other samples from this population 95% of them will have a sample proportion that is between 29% and 37%. -This statement that 95% of the confidence intervals will have a sample proportion between 29% and 37% does not make sense because confidence intervals are used to make inferences about the true parameter, not other sample proportions. This particular confidence interval may come from a very extreme sample, which would mean that many sample proportions would not fall within 29% and 37%. -We cannot conclude anything about the population parameter since this is only a sample. -We believe that the true proportion of county residents who want the law changed is between 29% and 37%. There is a 95% chance that the true parameter is 33%. A sample of 900 high school seniors were randomly selected for a national survey. Among the survey participants, 372 students were interested in pursuing a liberal arts degree within the next year. The sample proportion is 0.413. (a) What is the margin of error for a 99% confidence interval for this sample? (b) What is the lower endpoint for the 99% confidence interval? (a) .042 (b) .371 In which of the following scenarios would it be appropriate to use a Normal distribution to construct a 95% confidence interval for the parameter of interest? Select all that apply. -A state safety official wants to estimate the proportion of licensed cars in NC that have worn tires. Using the state car registration records, he randomly selects 100 cars. He inspects each car and finds that 12% of them have worn tires. -A state congressman wants to know the proportion of NC voters who support higher taxes to pay for state parks. He randomly selects five parks and talked with people at the parks. Of 200 voters found in the parks, 183 supported higher taxes to pay for state parks. -A police officer wants to know the proportion of licensed drivers who have had a speeding ticket within the last five years. He randomly selects 100 drivers from a [Show More]
Last updated: 1 year ago
Preview 4 out of 18 pages

Loading document previews ...
Buy this document to get the full access instantly
Instant Download Access after purchase
Buy NowInstant download
We Accept:

Reviews( 0 )
$16.00
Can't find what you want? Try our AI powered Search
Document information
Connected school, study & course
About the document
Uploaded On
Sep 14, 2024
Number of pages
18
Written in
All

Additional information
This document has been written for:
Uploaded
Sep 14, 2024
Downloads
0
Views
13