Statistics > QUESTIONS & ANSWERS > t test for single mean and t-test for difference of means (All)
t test for single mean and t-test for difference of means
Document Content and Description Below
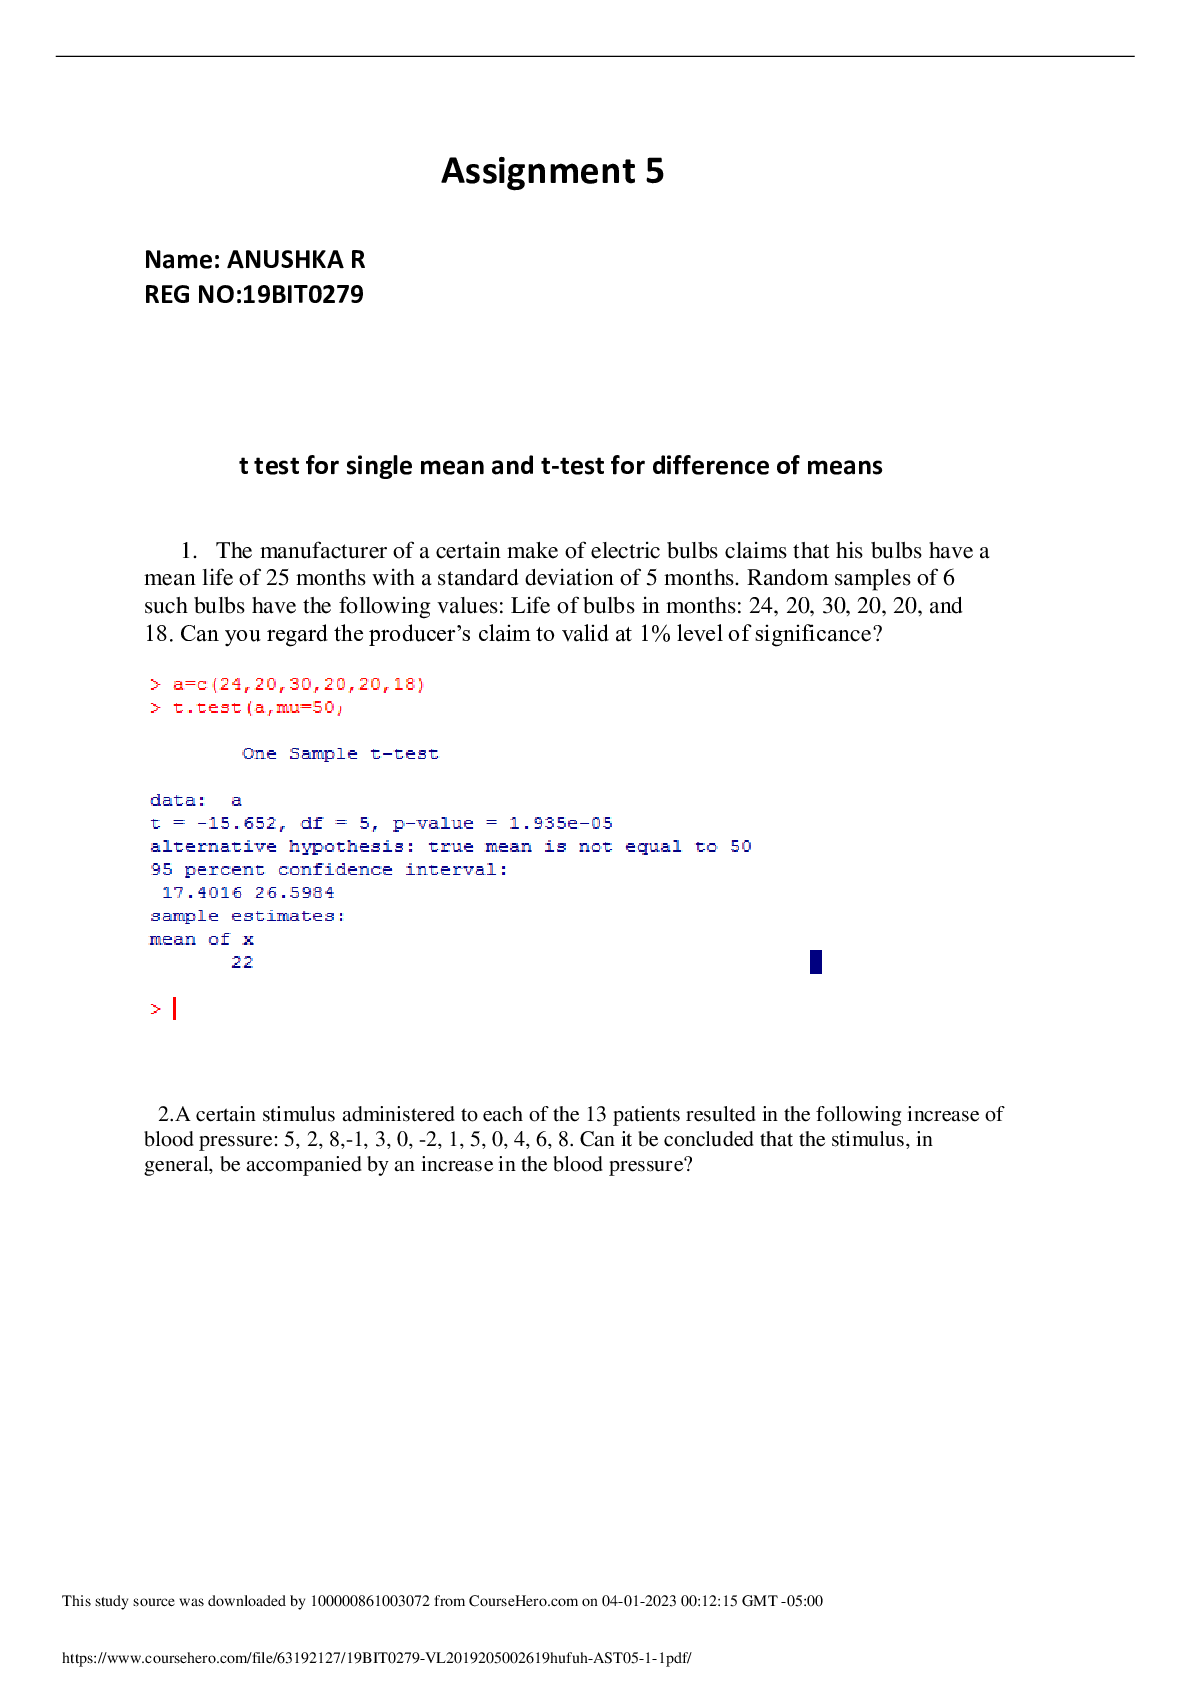
t test for single mean and t-test for difference of means 1. The manufacturer of a certain make of electric bulbs claims that his bulbs have a mean life of 25 months with a standard deviation of 5 m ... onths. Random samples of 6 such bulbs have the following values: Life of bulbs in months: 24, 20, 30, 20, 20, and 18. Can you regard the producer’s claim to valid at 1% level of significance? 2.A certain stimulus administered to each of the 13 patients resulted in the following increase of blood pressure: 5, 2, 8,-1, 3, 0, -2, 1, 5, 0, 4, 6, 8. Can it be concluded that the stimulus, in general, be accompanied by an increase in the blood pressure? 3. the life time of electric bulbs for a random sample of 10 from a large consignment gave the following data: 4.2, 4.6, 3.9, 4.1, 5.2, 3.8, 3.9, 4.3, 4.4, 5.6 (in ‘000 hours). Can we accept the hypothesis that the average life time of bulbs is 4, 000 hours 4. Data on weight (grams) of two treatments of NMU ( nistroso- methyl urea) are recorded. Find out whether these two treatments have identical effects by using t test for sample means at 5% level of significance. Sample 1 2 3 4 5 6 7 8 9 10 11 12 Treatments 0.2 % 2.0 2.7 2.9 1.9 2.1 2.6 2.7 2.9 3.0 2.6 2.6 2.7 0.4% 3.2 3.6 3.7 3.5 2.9 2.6 2.5 2.7 5. Hypothesis Tests for Two Means :Independent Data:Here we test for a difference in means for the following data No Drug(x1) 237 289 257 228 303 275 262 304 244 233 Drug(x2) 194 240 230 186 265 222 242 281 240 212 Paired t-test And F- (Variance Ratio Test) 1. A study was performed to test whether cars get better mileage on premium gas than on regular gas. Each of 10 cars was first filled with either regular or premium gas, decided by a coin toss, and mileage for that tank was recorded. The mileage was recorded again for the same car using the other kind of gasoline. We use a paired t – test to determine whether cars get significant better mileage with premium gas . Regular 16 20 21 22 23 22 27 25 27 28 Premium 19 22 24 24 25 25 26 26 28 2. The Scores of 10 candidates prior and after training are given below Prior 84 48 36 37 54 69 83 96 90 65 After 90 58 56 49 62 81 84 86 84 75 Test the training is Effective or Not? 3. An IQ test was administrated to 5 persons before and after they were trained. The results are given below Candidates I II III IV V IQ before Training 110 120 123 132 125 IQ After Training 120 118 125 136 121 Test whether there is any change in IQ after the training Programme 4. In order to compare the effectiveness of two sources of nitrogen, namely ammonium chloride and urea on grain yield of paddy, an experiment was conducted. The results on the grain yield of paddy(kg/plot) under the two treatments are given below Ammonium Chloride 13.4 10.9 11.2 11.8 14.0 15.3 14.2 12.6 17.0 16.2 16.5 15.7 Urea 12.0 11.7 10.7 11.2 14.8 14.4 13.9 13.7 16.9 16.0 15.6 16.0 Asses which sources nitrogen is better for paddy F Test to Compare Two Variances 5 .Five Measurements of the output of two units have given the following results (in kilograms of material per one hour of operation) .Assume that both samples have been obtained from normal populations, test at 10% significance level if two populations have the same variance. Unit A 14.1 10.1 14.7 13.7 14.0 Unit B 14.0 14.5 13.7 12.7 14.1 [Show More]
Last updated: 2 years ago
Preview 1 out of 7 pages
Buy this document to get the full access instantly
Instant Download Access after purchase
Buy NowInstant download
We Accept:

Reviews( 0 )
$7.00
Can't find what you want? Try our AI powered Search
Document information
Connected school, study & course
About the document
Uploaded On
Apr 11, 2023
Number of pages
7
Written in
All

Additional information
This document has been written for:
Uploaded
Apr 11, 2023
Downloads
0
Views
84