Statistics > EXAM > Summary 1ZM31 Multivariate Data Analysis by Hair 2023. (All)
Summary 1ZM31 Multivariate Data Analysis by Hair 2023.
Document Content and Description Below
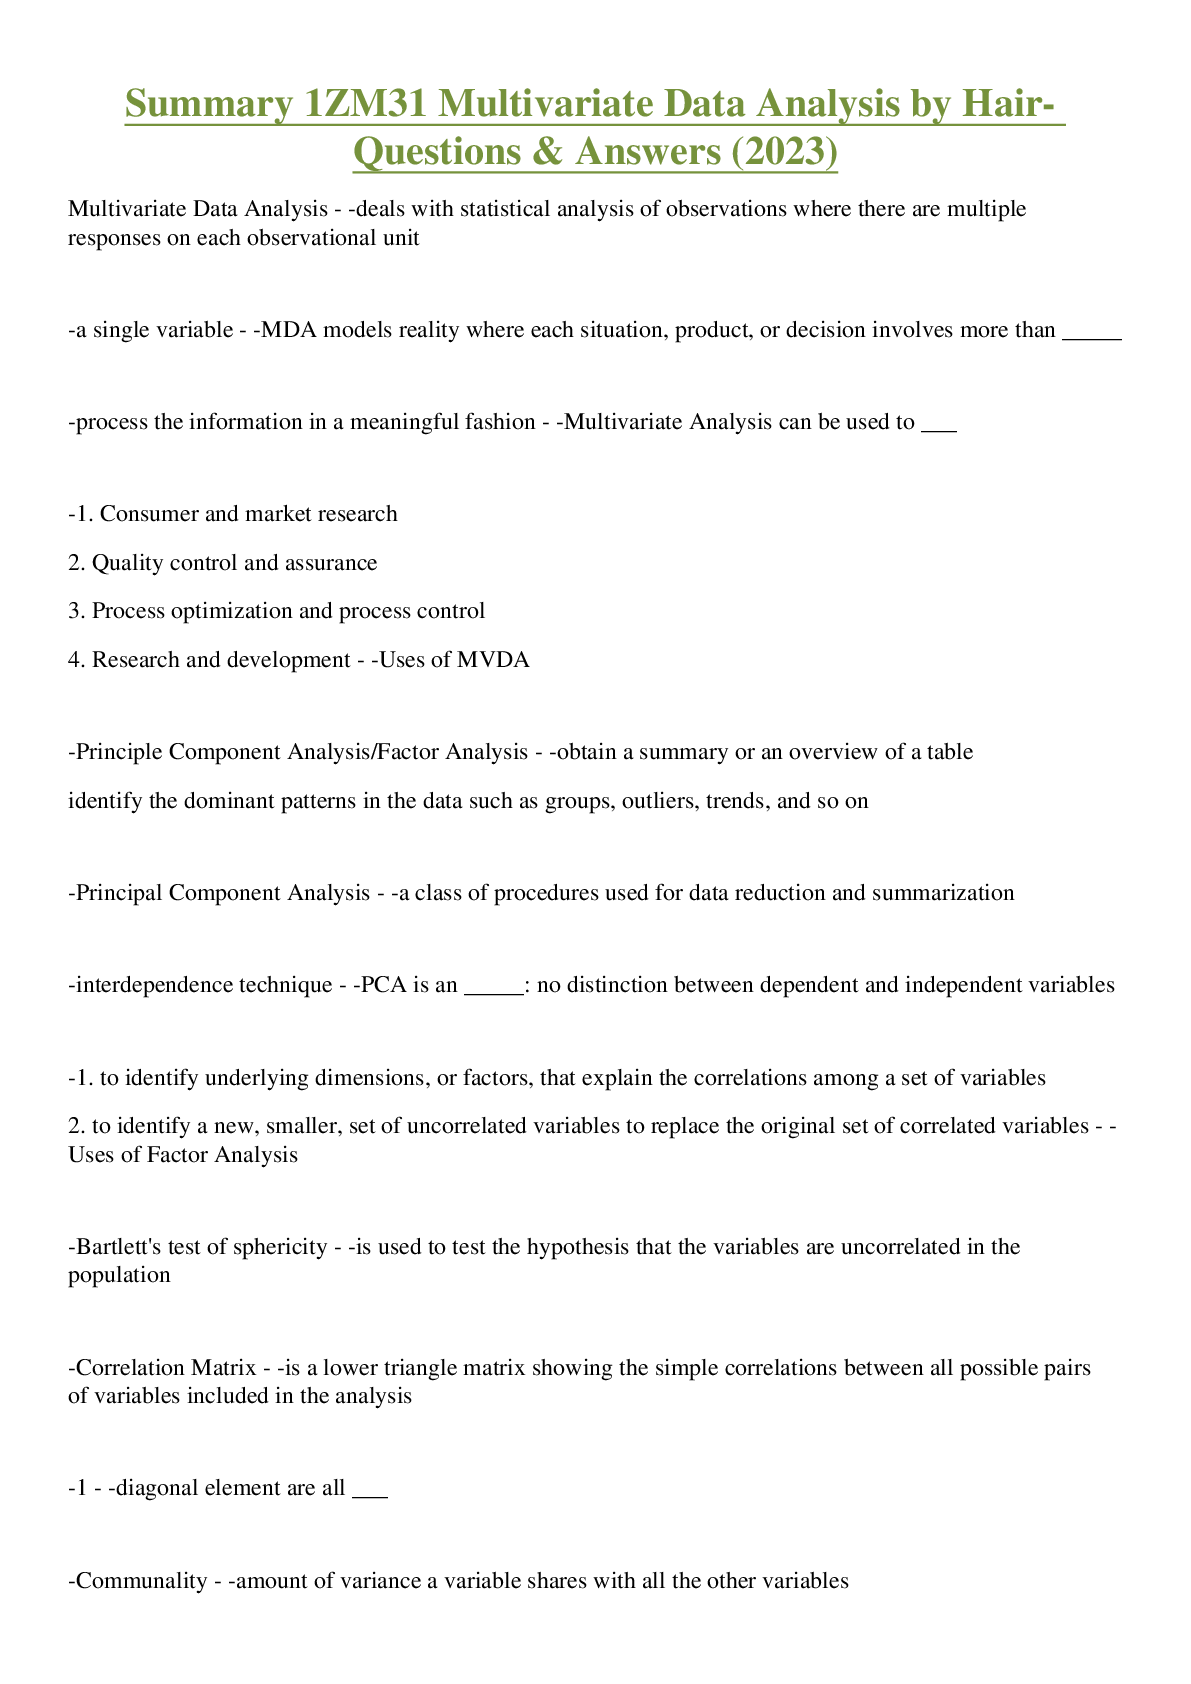
Multivariate Analysis - -deals with the statistical analysis of observations where there are multiple responses on each observational unit. -Multivariate Analysis - -This essentially models reality ... where each situation, product, or decision involves more than a single variable. -quantum of data - -Despite the ____________________ available, the ability to obtain a clear picture of what is going on and make intelligent decisions is a challenge. -process the information in a meaningful fashion - -When available information is stored in database tables containing rows and columns, Multivariate Analysis can be used to __________________ -USES OF MVDA - -- Consumer and market research - Quality control and quality assurance across a range of industries such as food and beverage, paint, pharmaceuticals, chemicals, energy, telecommunications, etc. - Process optimization and process control - Research and development -TYPES OF MVDA - -1. Principal Component Analysis/ Factor Analysis 2. Classification and Discriminant Analysis 3. Multiple Regression Analysis or Partial Least Squares -Principal Component Analysis/ Factor Analysis - -Obtain a summary or an overview of a table -Principal Component Analysis/ Factor Analysis - -identify the dominant patterns in the data, such as groups, outliers, trends, and so on -Factor Analysis and Principal Components Analysis - -a class of procedures used for data reduction and summarization. -interdependence technique - -Factor Analysis and Principal Components Analysis is an _____________________: no distinction between dependent and independent variables. -Uses of Factor Analysis - -- To identify underlying dimensions, or factors, that explain the correlations among a set of variables. - To identify a new, smaller, set of uncorrelated variables to replace the original set of correlated variables. -Factor score coefficients - -The first set of weights that are chosen so that the first factor explains the largest portion of the total variance -Bartlett's test of sphericity - -used to test the hypothesis that the variables are uncorrelated in the population (i.e., the population corr matrix is an identity matrix) -Correlation Matrix - -a lower triangle matrix showing the simple correlations, r, between all possible pairs of variables included in the analysis. The diagonal elements are all 1. -Communality - -Amount of variance a variable shares with all the other variables. This is the proportion of variance explained by the common factors. -Eigenvalue - -Represents the total variance explained by each factor. -Factor loadings - -Correlations between the variables and the factors. -Factor Matrix - -contains the factor loadings of allthe variables on all the factors -Factor Scores - -are composite scores estimated for each respondent on the derived factors. -Kaiser-Meyer-Olkin (KMO) measure of sampling adequacy - -Used to examine the appropriateness of factor analysis. High values (between 0.5 and 1.0) indicate appropriateness. Values below 0.5 imply not. -Percentage of Variance - -The percentage of the total variance attributed to each factor. -Scree Plots - -is a plot of the Eigenvalues against the number of factors in order of extraction. -Principal Component Analysis - -An exploratory technique used to reduce the dimensionality of the data set to 2D or 3D -Principal Component Analysis - -• Can be used to: -Reduce number of dimensions in data -Find patterns in high-dimensional data -Visualize data of high dimensionality -Principal Component Analysis Steps - -1. Standardize the data. 2. Obtain the Eigenvalues and Eigenvectors from the covariance matrix or correlation matrix, or perform a Singular Vector Decomposition 3. Sort eigenvalues in descending order and choose the k eigenvectors that correspond to the k largest eigenvalue where k is the number of dimensions of the new feature subspace (k < d). 4. Transform the projection matrix W from the selected k eigenvalues. 5. Transform the original dataset X via W to obtain a k-dimensional feature subspace. -Classification and Discriminant Analysis - -Analyze groups in the table, how these groups differ, and to which group individual table rows belong. -Discriminant Analysis - -is used to determine which variables discriminate between two or more naturally occurring groups. -Analysis of Variance (ANOVA) - -Discriminant function analysis is very similar to ___________________. -Multiple Regression Analysis or Partial Least Squares - -Find relationships between columns in data tables -Multiple Regression Analysis or Partial Least Squares - -To use one set of variables (columns) to predict another, for the purpose of optimization, to find out which columns are important in the relationship. - [Show More]
Last updated: 2 years ago
Preview 1 out of 3 pages
Buy this document to get the full access instantly
Instant Download Access after purchase
Buy NowInstant download
We Accept:

Reviews( 0 )
$11.50
Can't find what you want? Try our AI powered Search
Document information
Connected school, study & course
About the document
Uploaded On
Apr 08, 2023
Number of pages
3
Written in
All

Additional information
This document has been written for:
Uploaded
Apr 08, 2023
Downloads
0
Views
76