Data analytics Quizzes
$ 19

Statistic Final Exam 2021/2022
$ 10

Fore School Of Management STATS SMAdvance_Stats PROJECT 2
$ 8

ServSafe Certification Exam New-2023. Reviwed Score 100%
$ 11
.png)
AQA A-level ENGLISH LITERATURE A 7712/2B Paper 2B Texts in shared contexts: Modern times: Literature from 1945 to the present day Mark scheme June 2021 Version: 1.0 Final Mark Scheme
$ 10

Florida Atlantic University STA STA 2023 In what follows use any of the following tests/procedures: Regression, multiple regression, confidence intervals, one sided Ttest or two sided Ttest.... Share Question
$ 7

An Introduction to Probability and Statistics by Vijay K Rohatgi, A K MD Ehsanes
$ 20
eBook EPUB PDF Applied Statistics I Basic Bivariate Techniques 3rd Edition By Rebecca M. Warner
$ 27

STAT 200 Week 7 Homework Problems_With Verified Solutions
$ 13

Mark Scheme (Results) Summer 2019 Pearson Edexcel International GCSE In Turkish (4TU0) Paper 1. Graded A+
$ 9
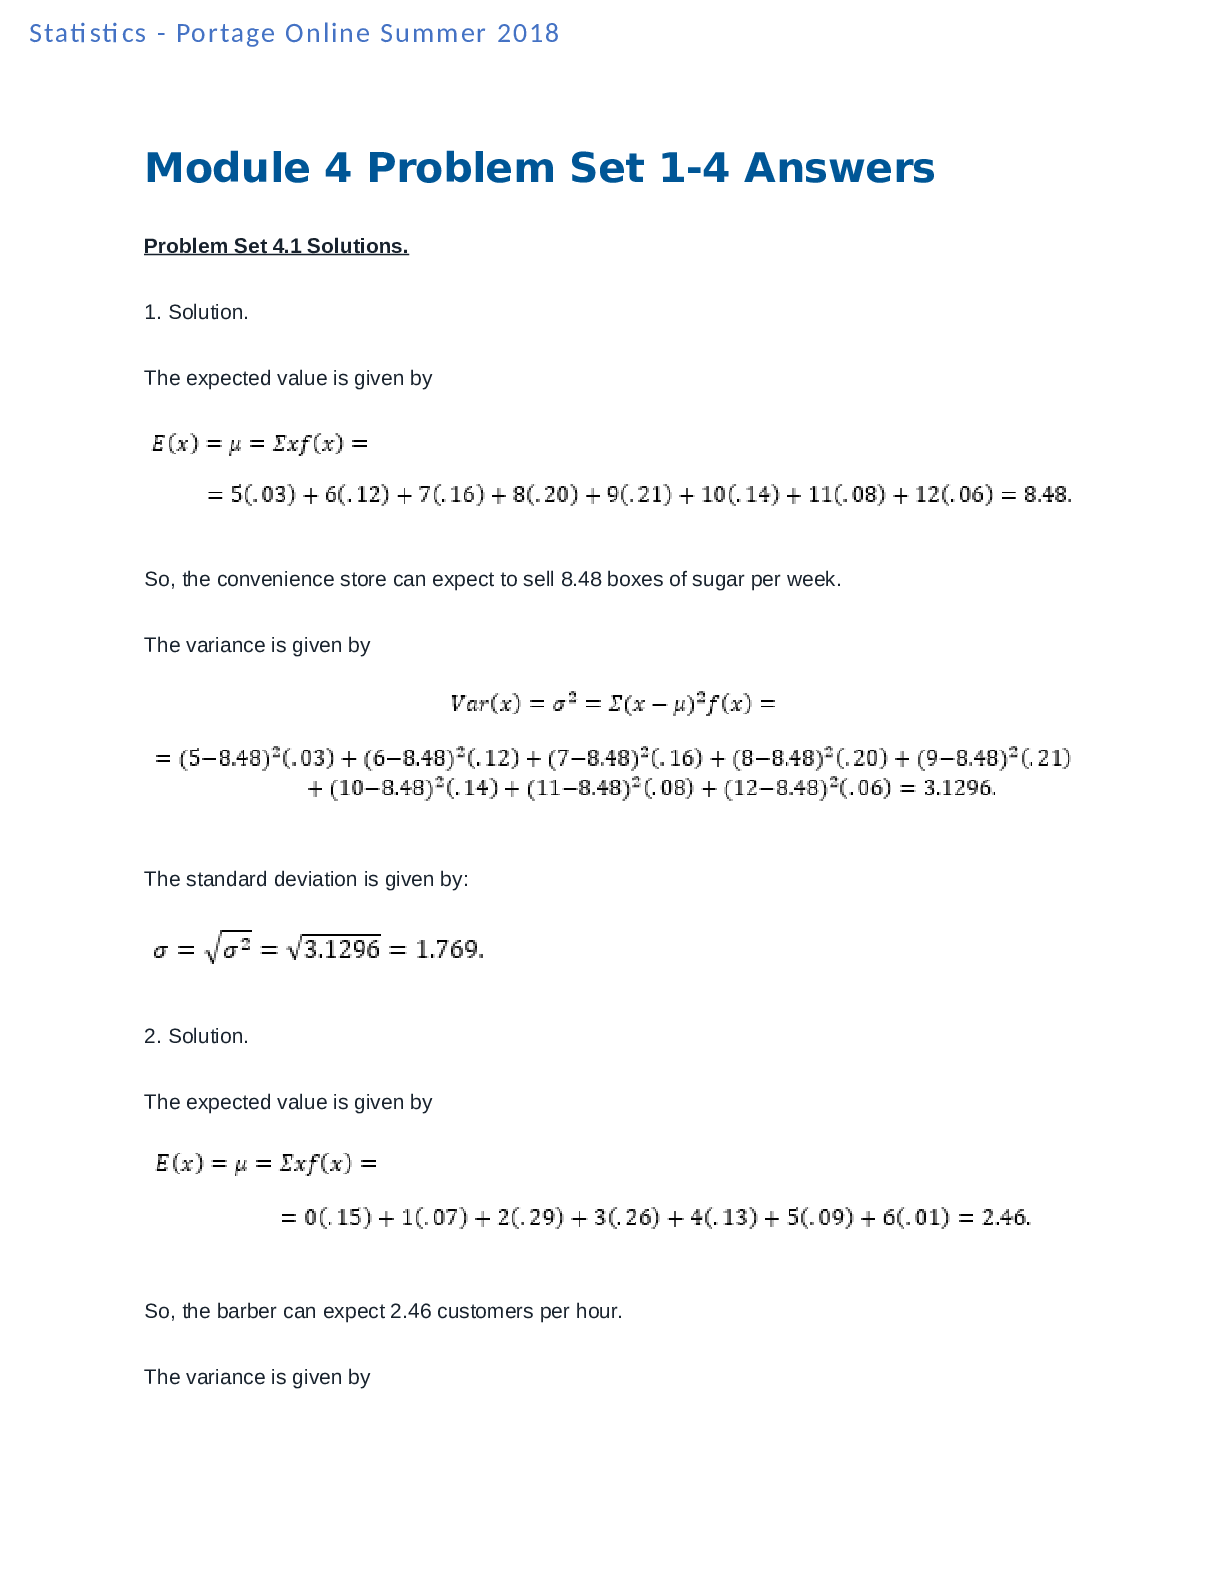
Portage Learning MATH 110 Module 4 Problem Sets 1-4 Answers (All Answers are Correct)
$ 11

Sophia Statistics Unit 4 Milestone, questions/Answers/Rationale, Latest Summer 2021/2022
$ 12

STAT 200 Week 3 Homework Problems.LATEST 2021/2022
$ 15
.png)
Pearson Edexcel Level 3 GCE 9ST0/02 2022 Statistics Advanced PAPER 2: Statistical Inference
$ 10

FTCE Subject Area Exam K-6 Practice Questions & Accurate answers. 100% Pass rate.
$ 12
CS234 Data Types and Structures Spring 2015 Example Questions for the Final Exam
$ 11

CS 234 Lectures Slides S14

.png)
.png)


.png)