HRM 531
$ 8

CHEM 120 Unit 6 Lab: OL Lab 11: Carbohydrates: The Sugars That Feed Us (GRADED A)
$ 7.5
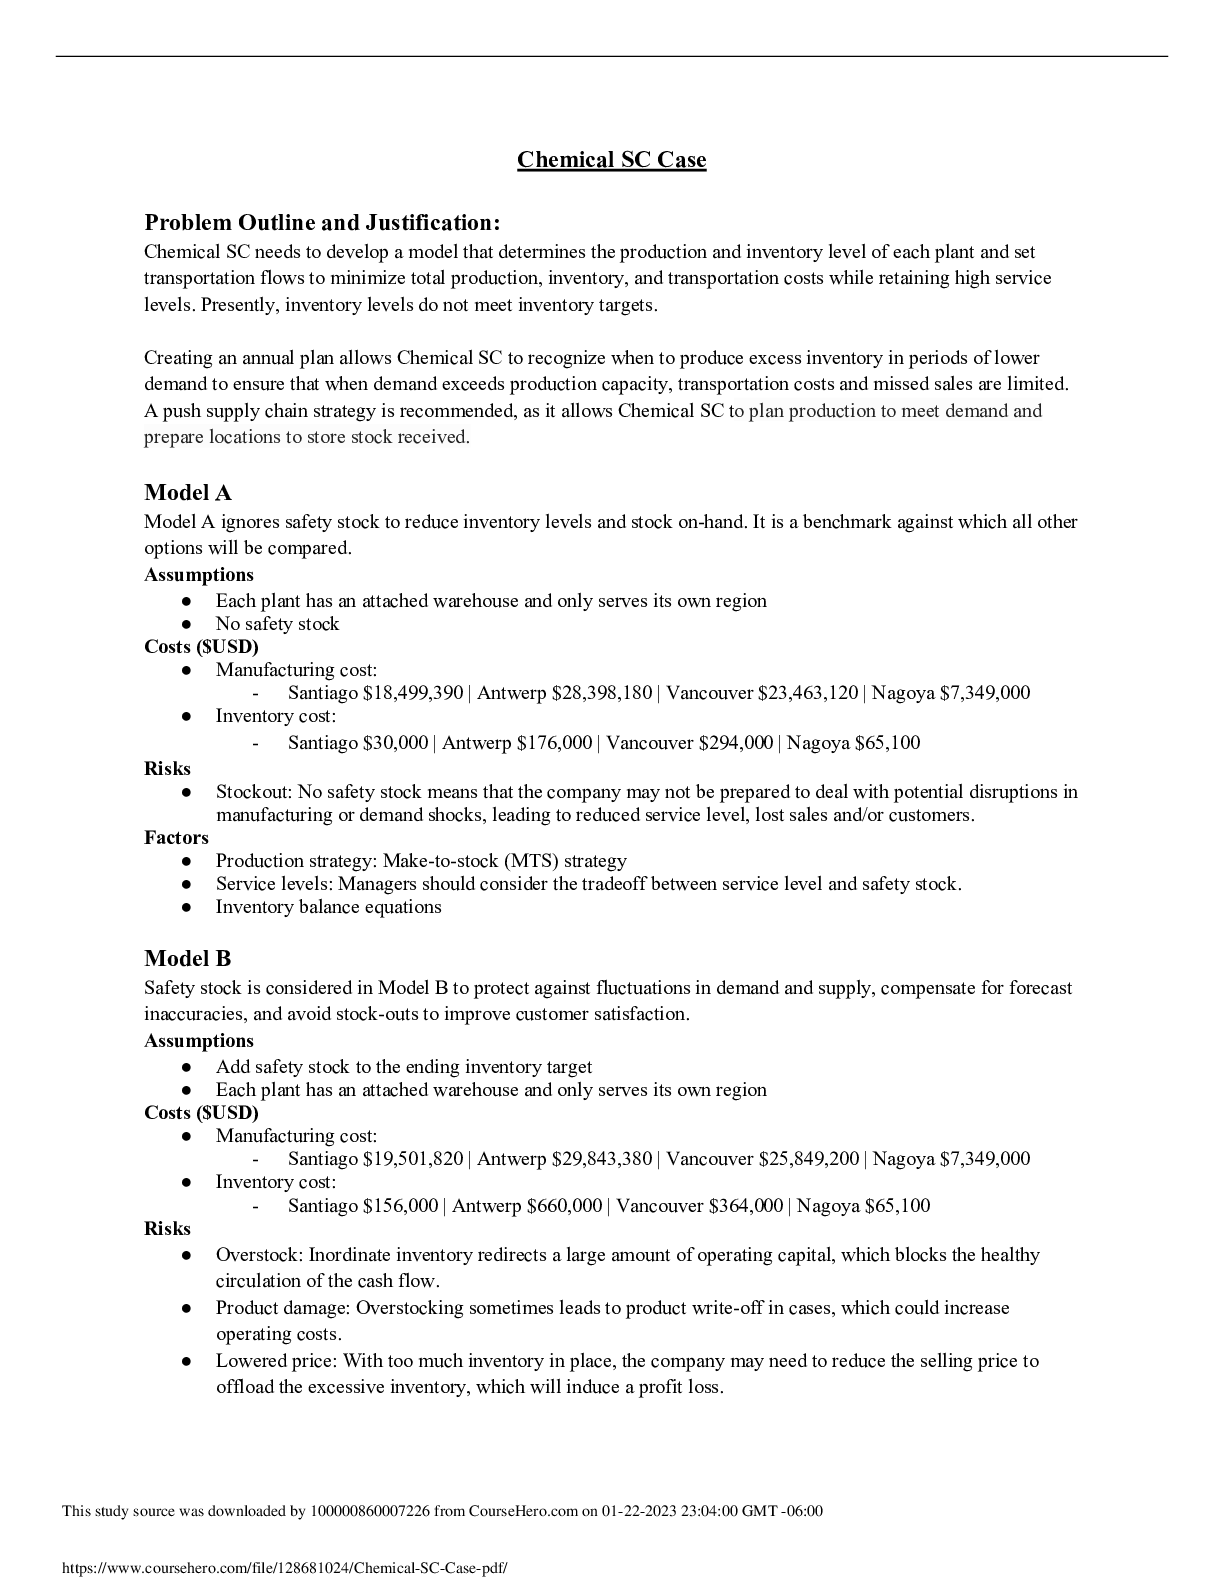
Case Study > Chemical SC Case University of British Columbia _Chemical SC Case: needs to develop a model that determines the production and inventory level of each plant and set transportation flows to minimize total production, inventory, and transportation costs while retaining high service levels. Presently, inventory levels do not meet inventory targets.
$ 4
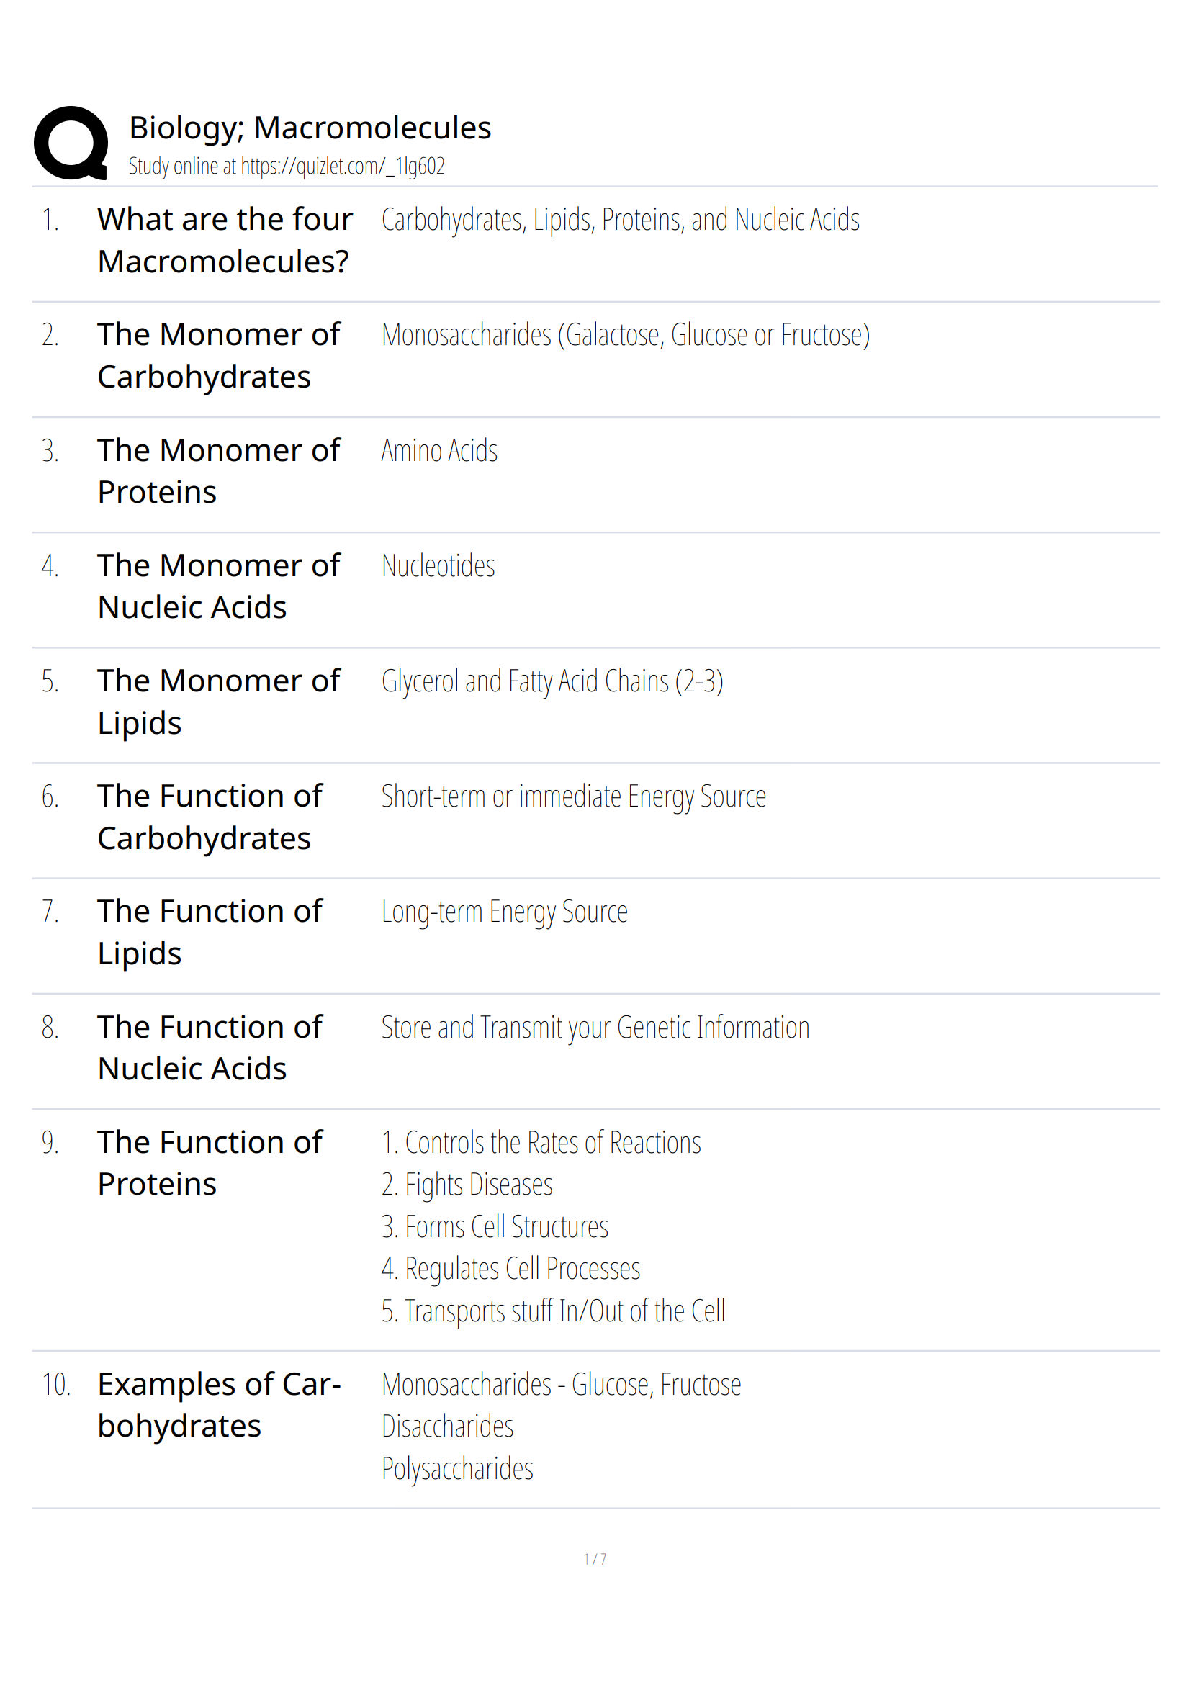
BIO 101 Macromolecules / Score 100% / 2025 Update / Study Guide, Quiz & Exam Prep
$ 7.5

LGI Online Test / 2025 Lifeguard Instructor Certification Exam Prep & Practice
$ 13
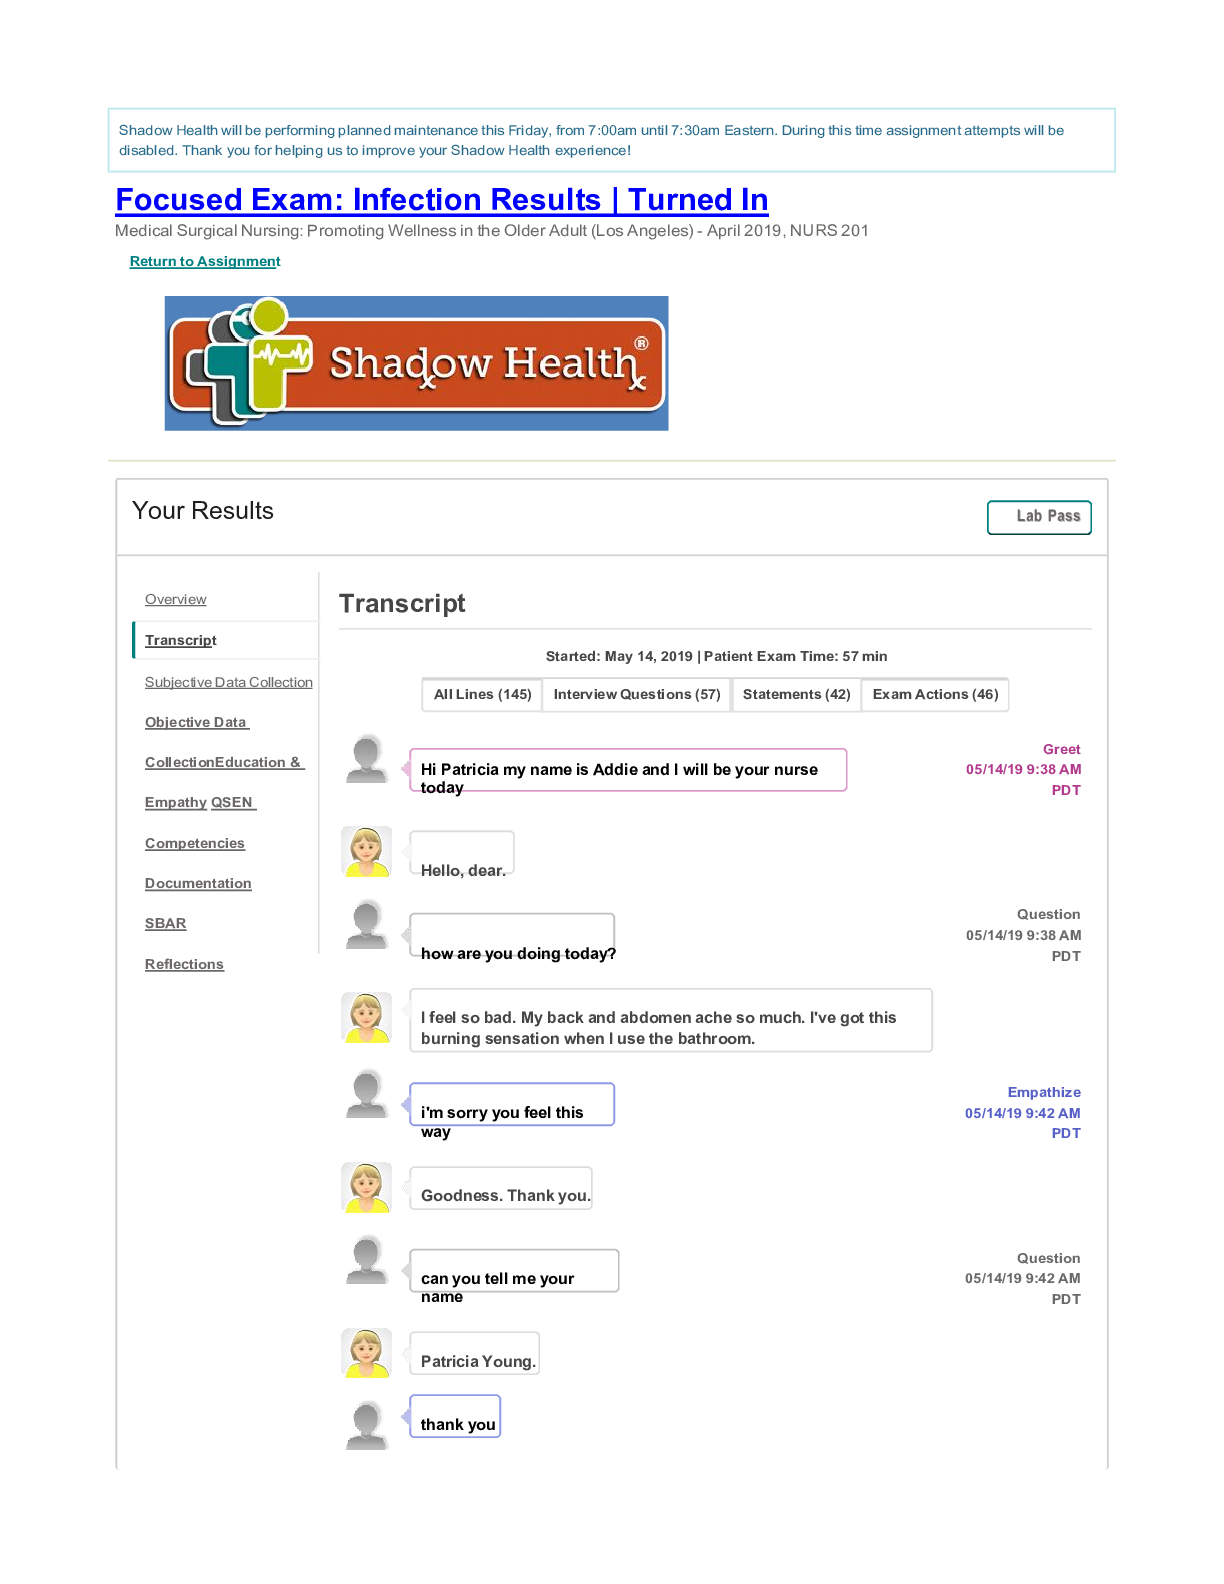
SHADOW HEALTH:Focused Exam: Infection Results Transcript
$ 9
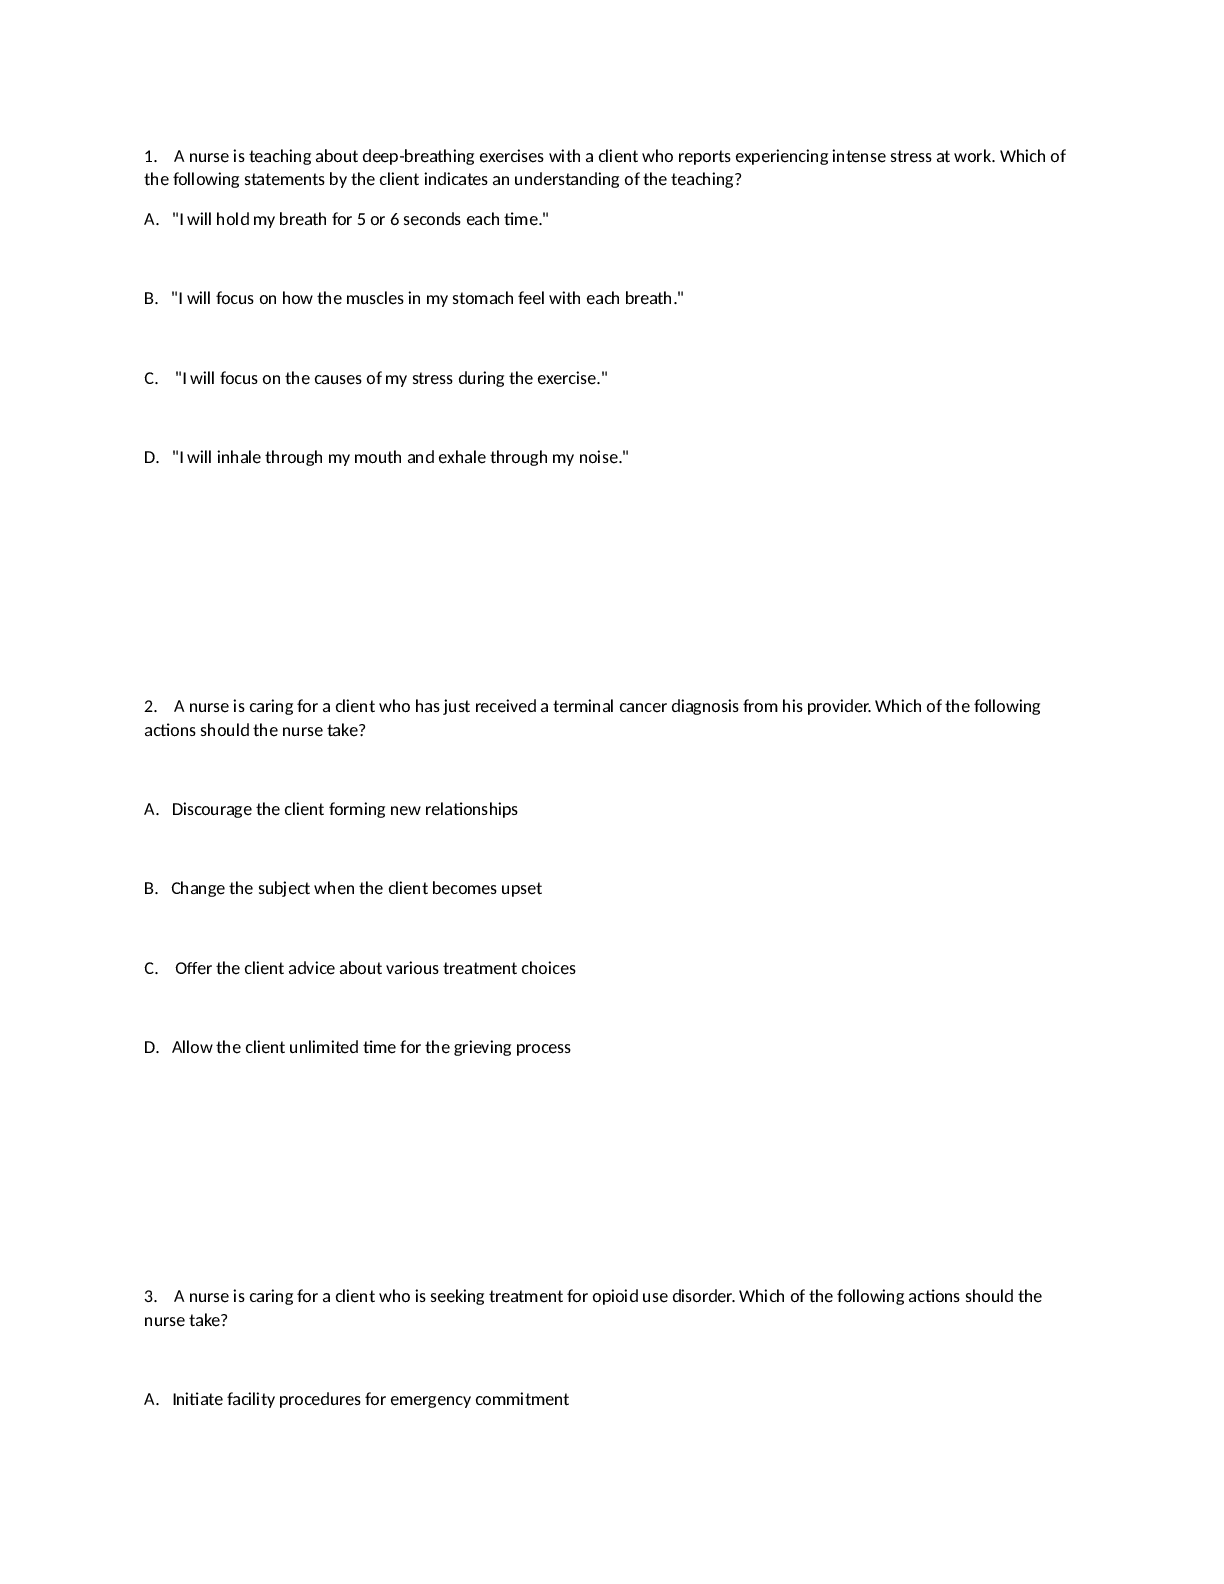
mental health 2.
$ 6.5
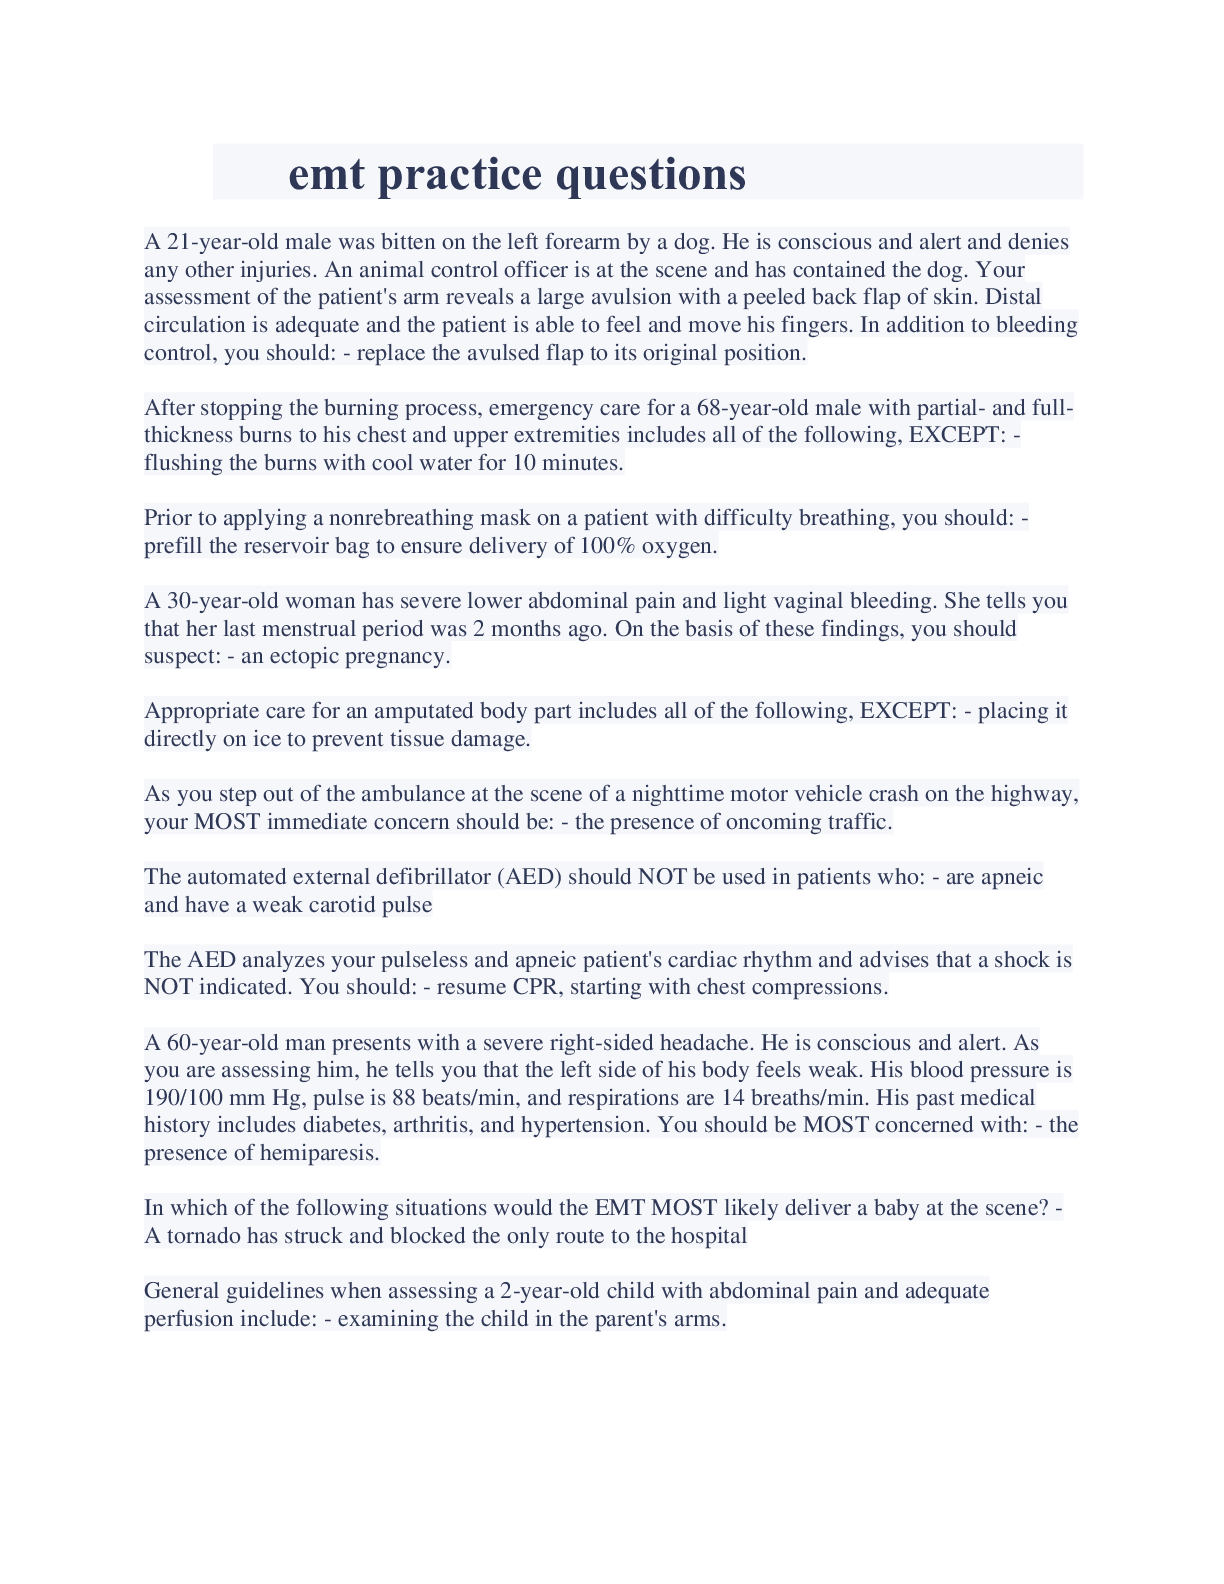
emt practice questions and answers comprehensive coverage 2023
$ 9.5
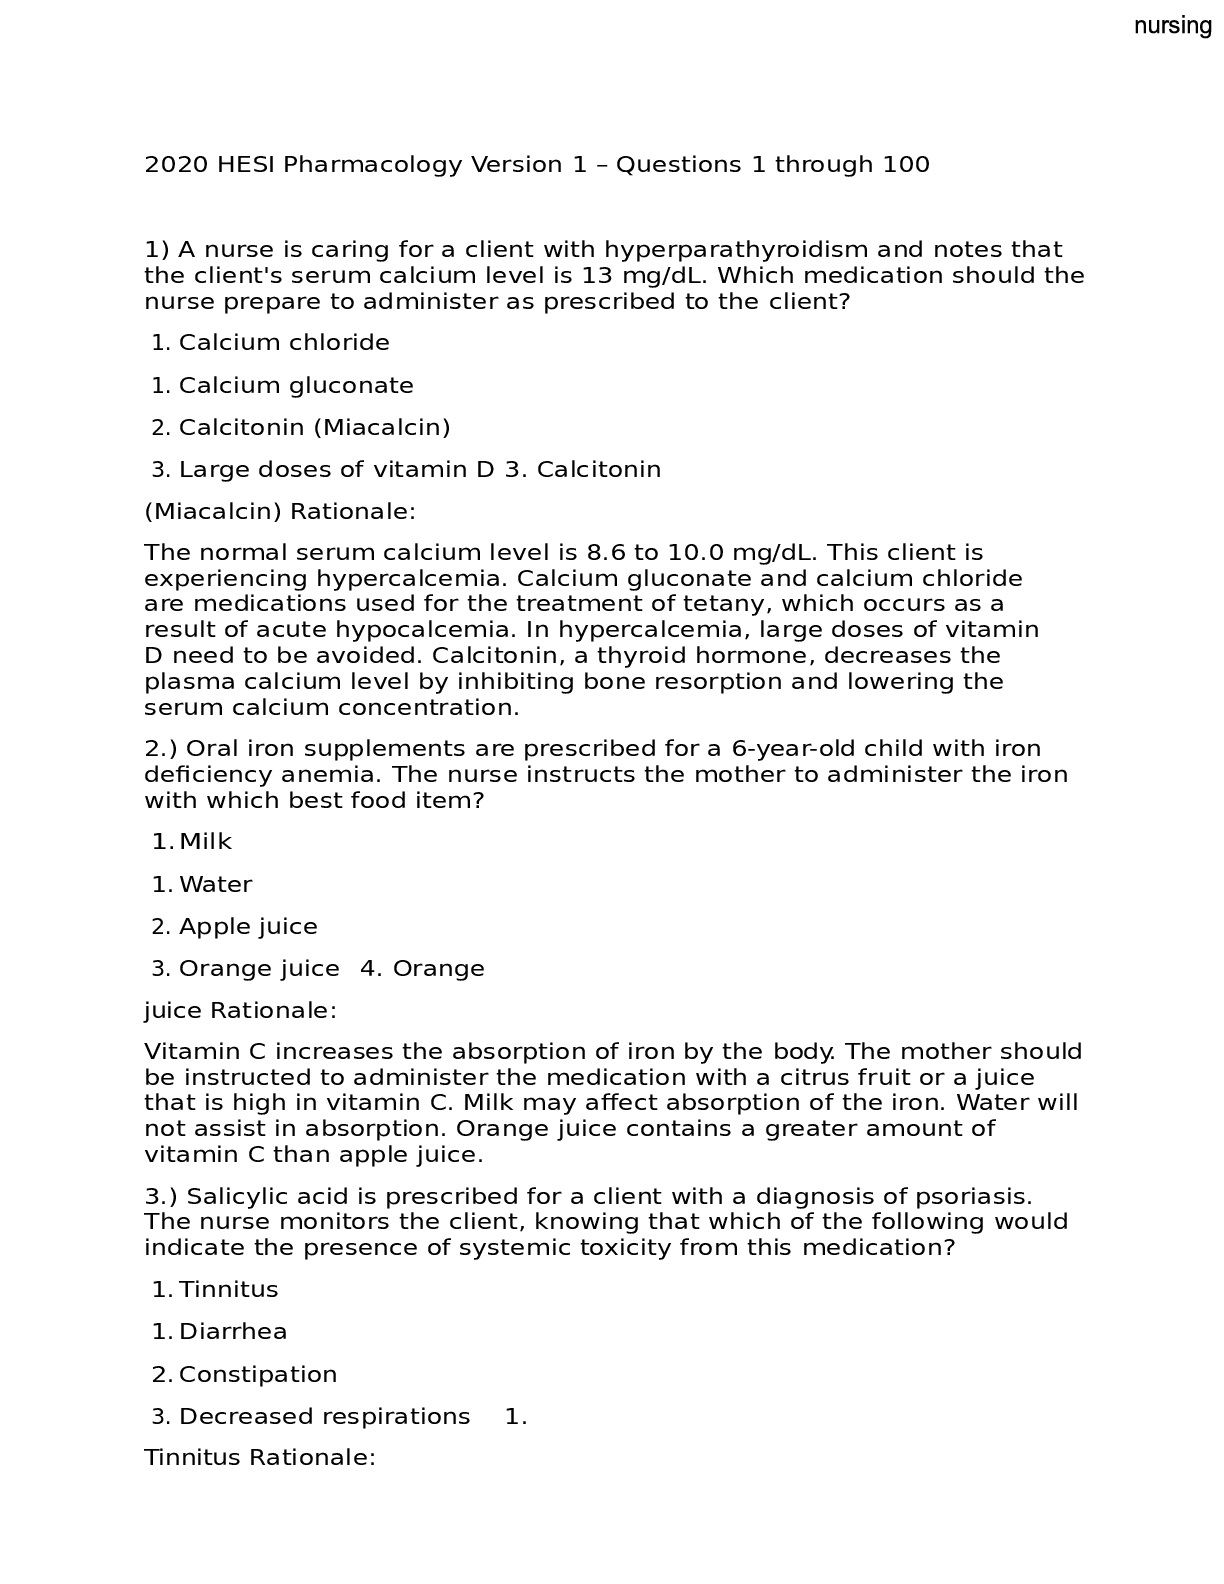
2020 HESI Pharmacology Version 1
$ 7

Week 9-Comprehensive 2-7.
$ 5.5

eBook Birds in Roman Life and Myth Global Perspectives on Ancient Mediterranean Archaeology 1st Edition By Ashleigh Green
$ 30
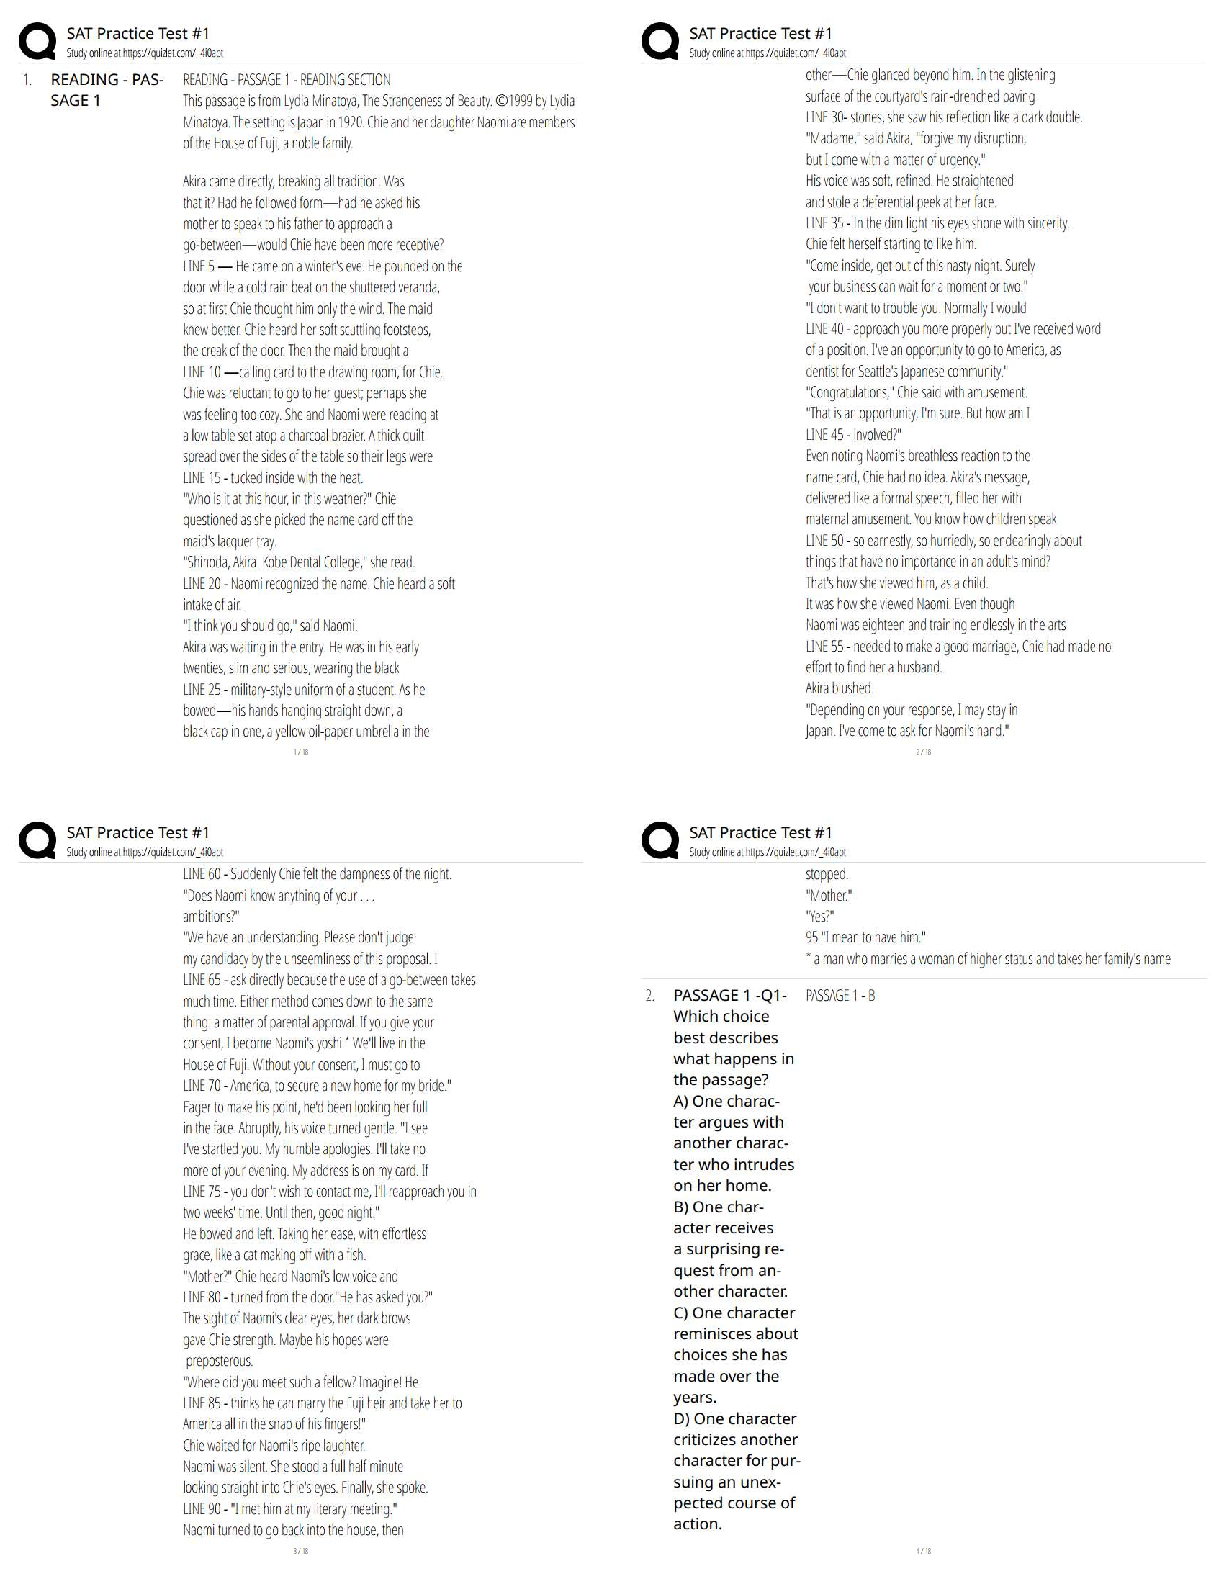
SAT Practice Test #1 / Score 100% / 2025 Update / Full-Length Exam Prep
$ 9
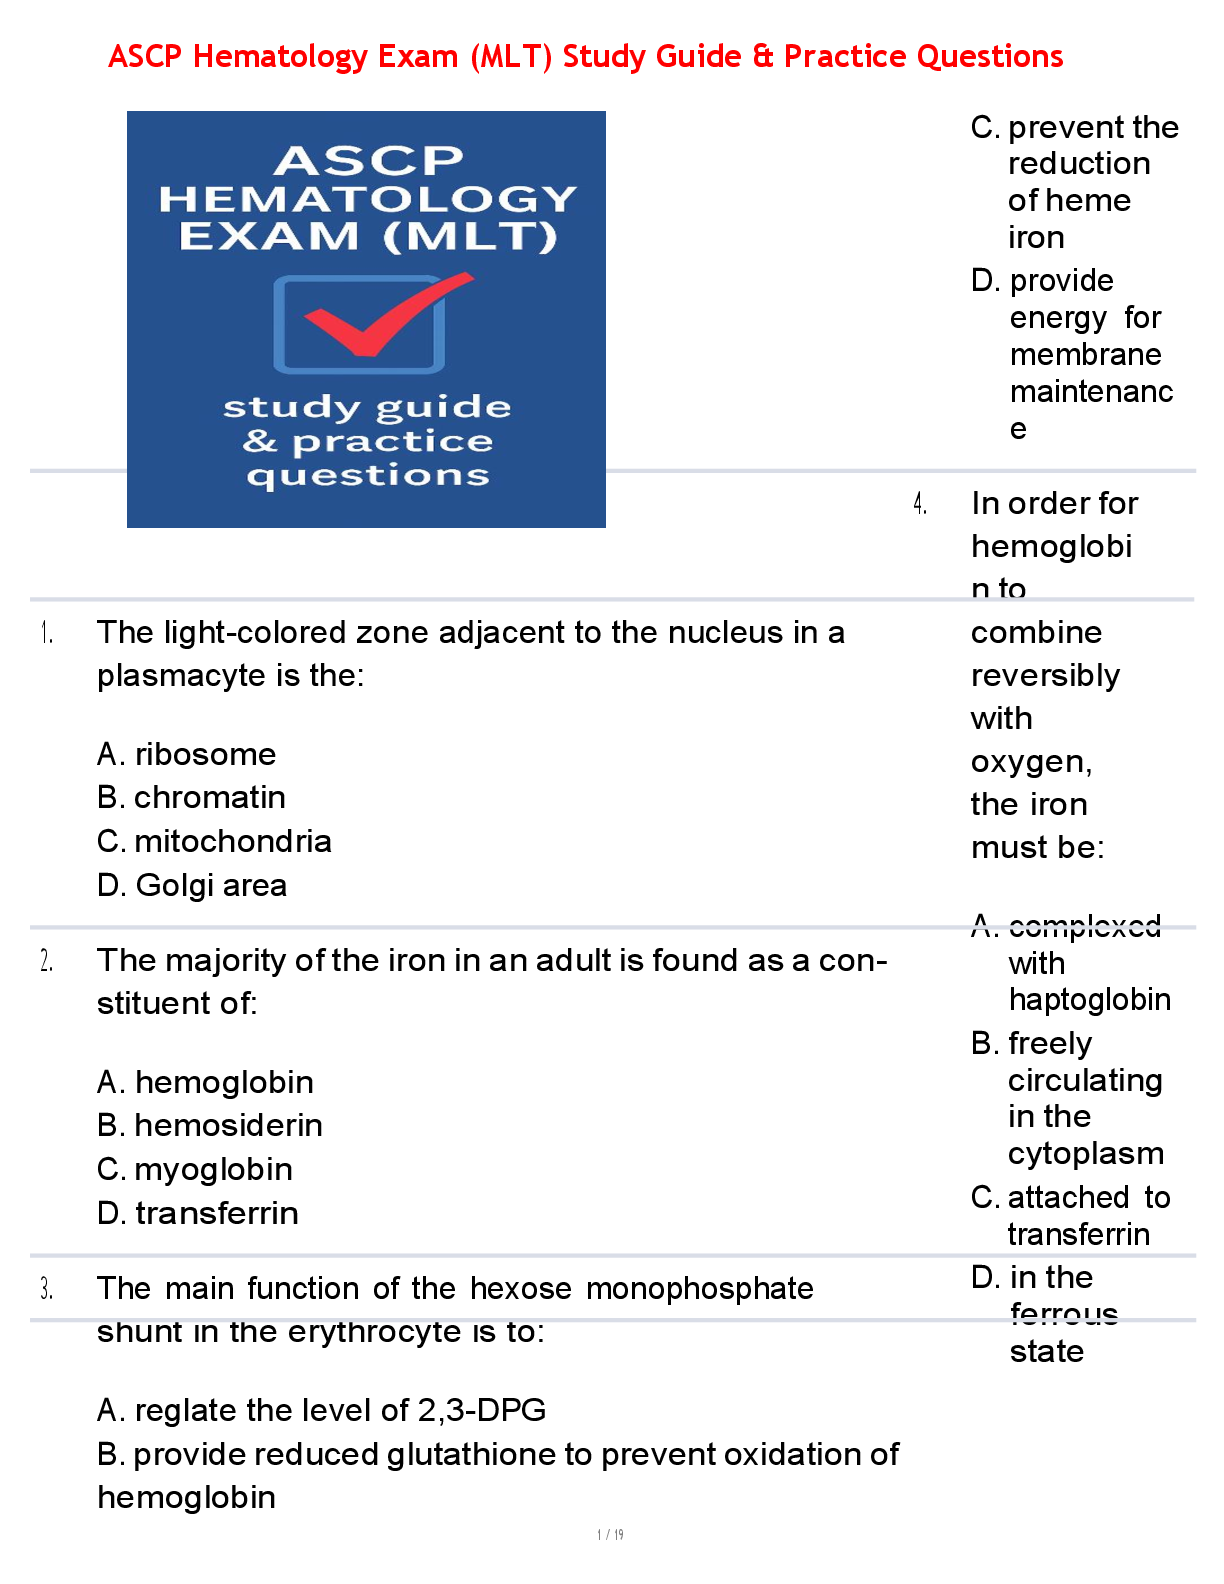
ASCP Hematology Exam (MLT) Study Guide & Practice Questions


 (1).png)