Statistics > Solutions Guide > Hypothesis Test for the Mean (All)
Hypothesis Test for the Mean
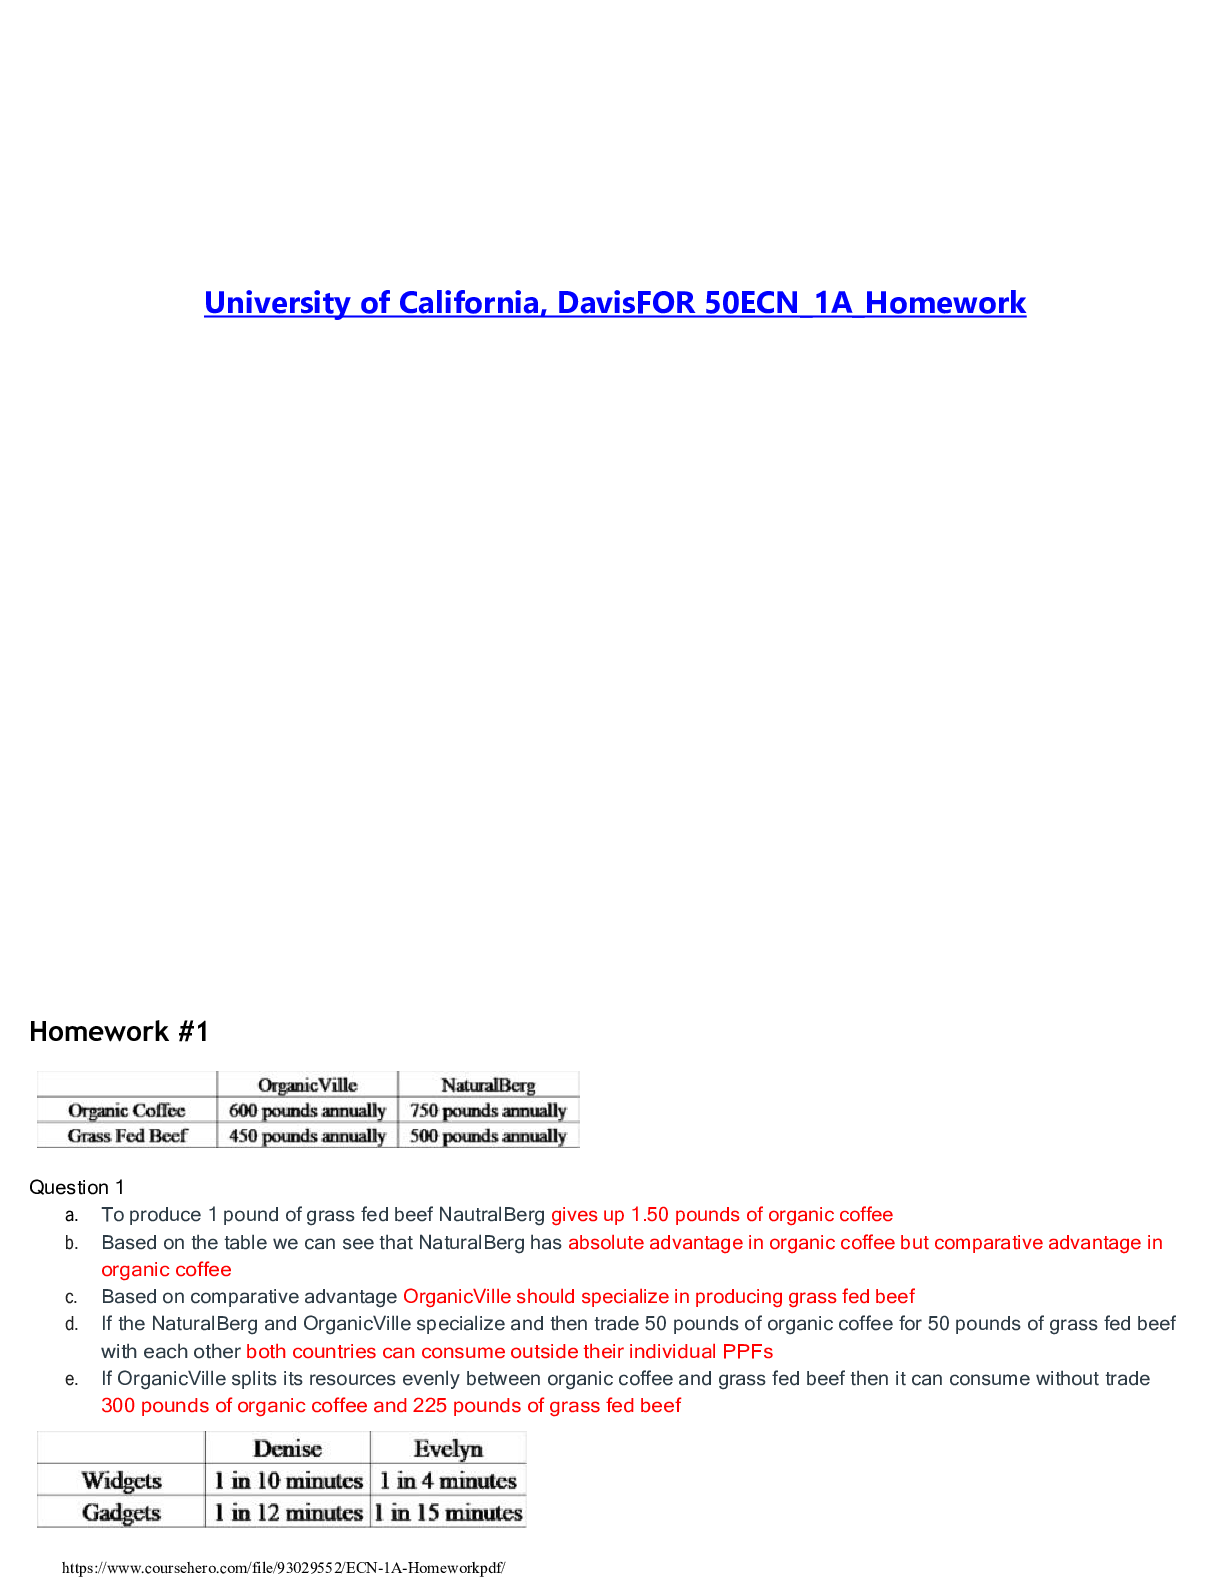
Document Content and Description Below
Hypothesis Test for the Mean - Population
Standard Deviation Known/week 7
1. Jamie, a bowler, claims that her bowling score is less than 168 points, on
average. Several of her teammates do not believe her, so she deci
...
[Show More]
Last updated: 3 years ago
Preview 1 out of 7 pages
Instant download

Buy this document to get the full access instantly
Instant Download Access after purchase
Reviews( 0 )
$11.50
127
0
Document information
Connected school, study & course
About the document
Uploaded On
May 15, 2021
Number of pages
7
Written in
All

Additional information
This document has been written for:
Uploaded
May 15, 2021
Downloads
0
Views
127
Document Keyword Tags
Recommended For You
Get more on Solutions Guide ».png)
$12
250 Pages
Business Statistics, 4e Norean Sharpe, Richard Veaux, Paul Vel...

$27.5
320 Pages
Sampling Design and Analysis, 3e by Sharon Lohr (Solutions Man...

$25
502 Pages
Statistics: Informed Decisions Using Data, 6th edition Michael...


![Preview of eBook [PDF] Mind on Statistics 6th Edition By Utts Heckard](https://browseimages.nyc3.digitaloceanspaces.com/paper-images/2026/04/29/YJskuJXm2026-04-29-08-2869f1970eda885.png)

$14.5
166 Pages
ROSH REVIEW-Pediatrics Test bank Full answered each deeply exp...

$13
94 Pages
Fundamentals of Computer Vision (Complete Instructor Resources...
 2022 test Bank.png)
$5.5
236 Pages
AI-900 Microsoft Azure AI Fundamentals Certification exam test...

$8
5 Pages
CS 154 Formal Languages and Computability Midterm Exam II, ANS...

$3
2 Pages
Georgia Institute Of Technology - MGT 6203Week-09 SA-5 Solutio...
$7
2 Pages
North Arkansas College FIN FIN 145 1.Table 8.4 reproduces J...


$11
31 Pages


.png)
.png)
.png)


.png)
.png)
