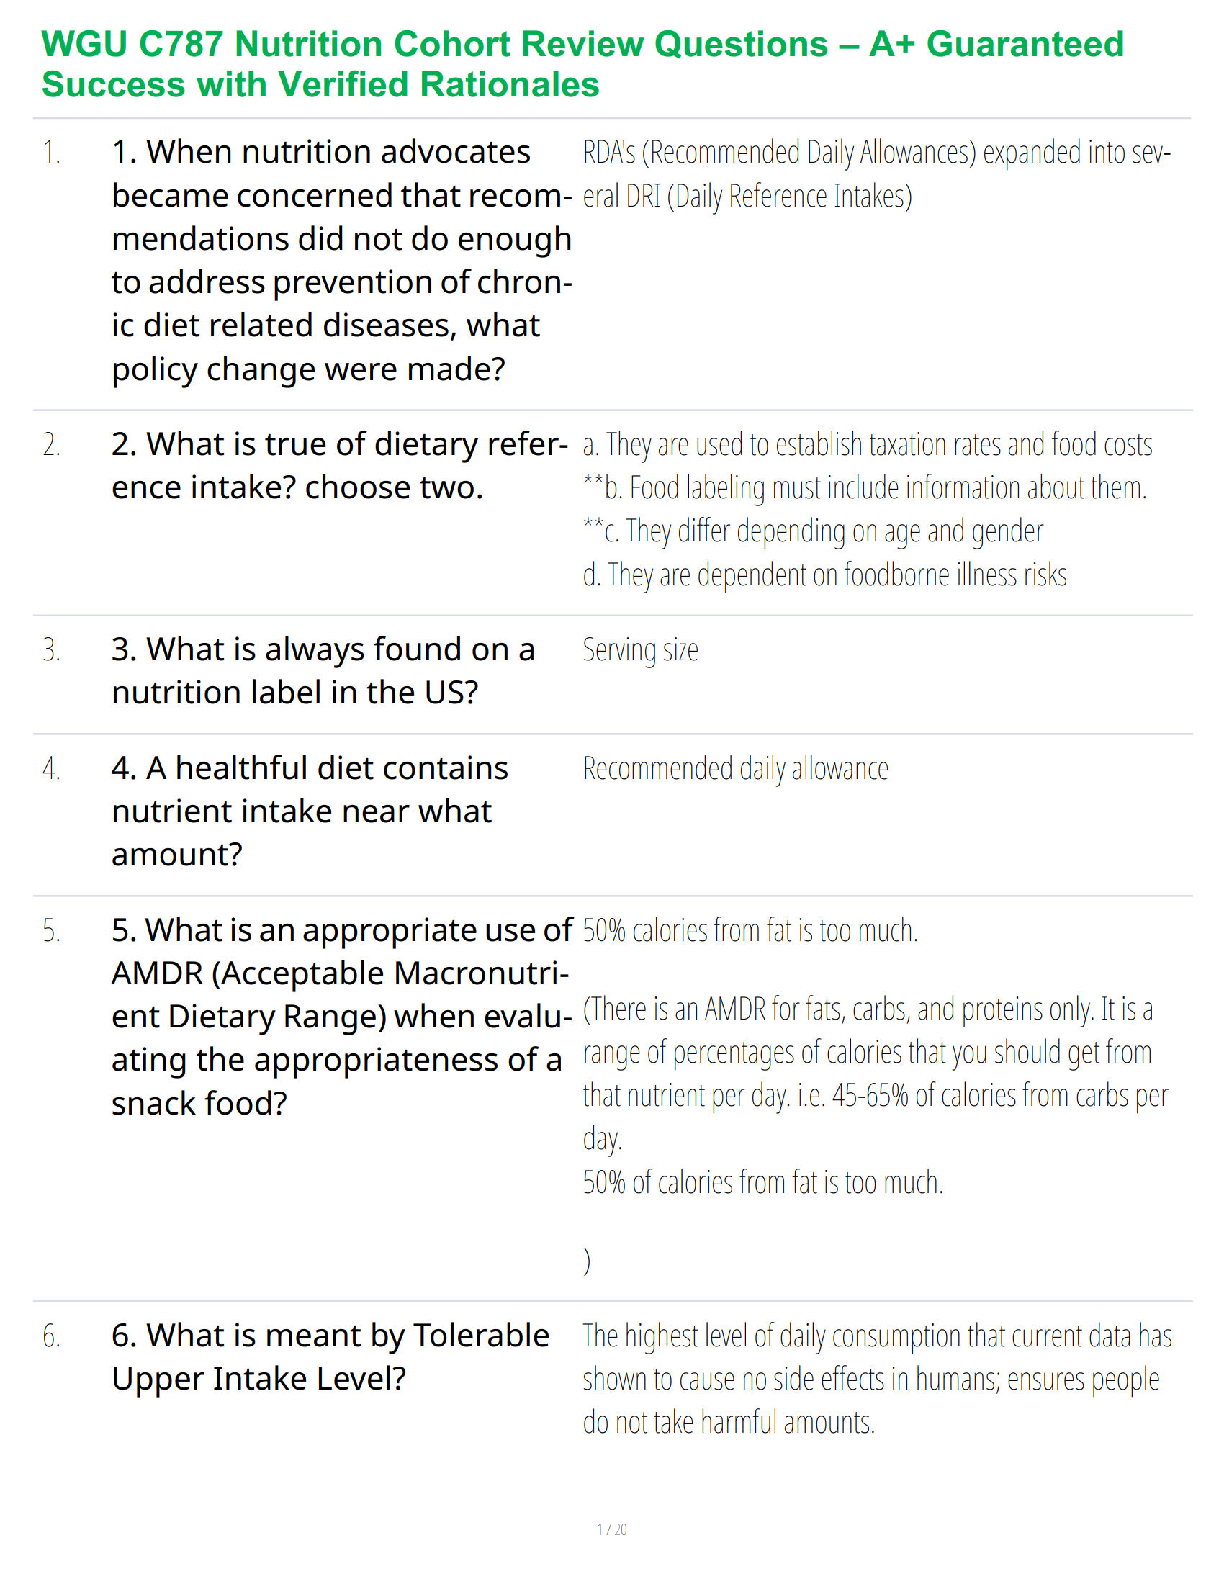
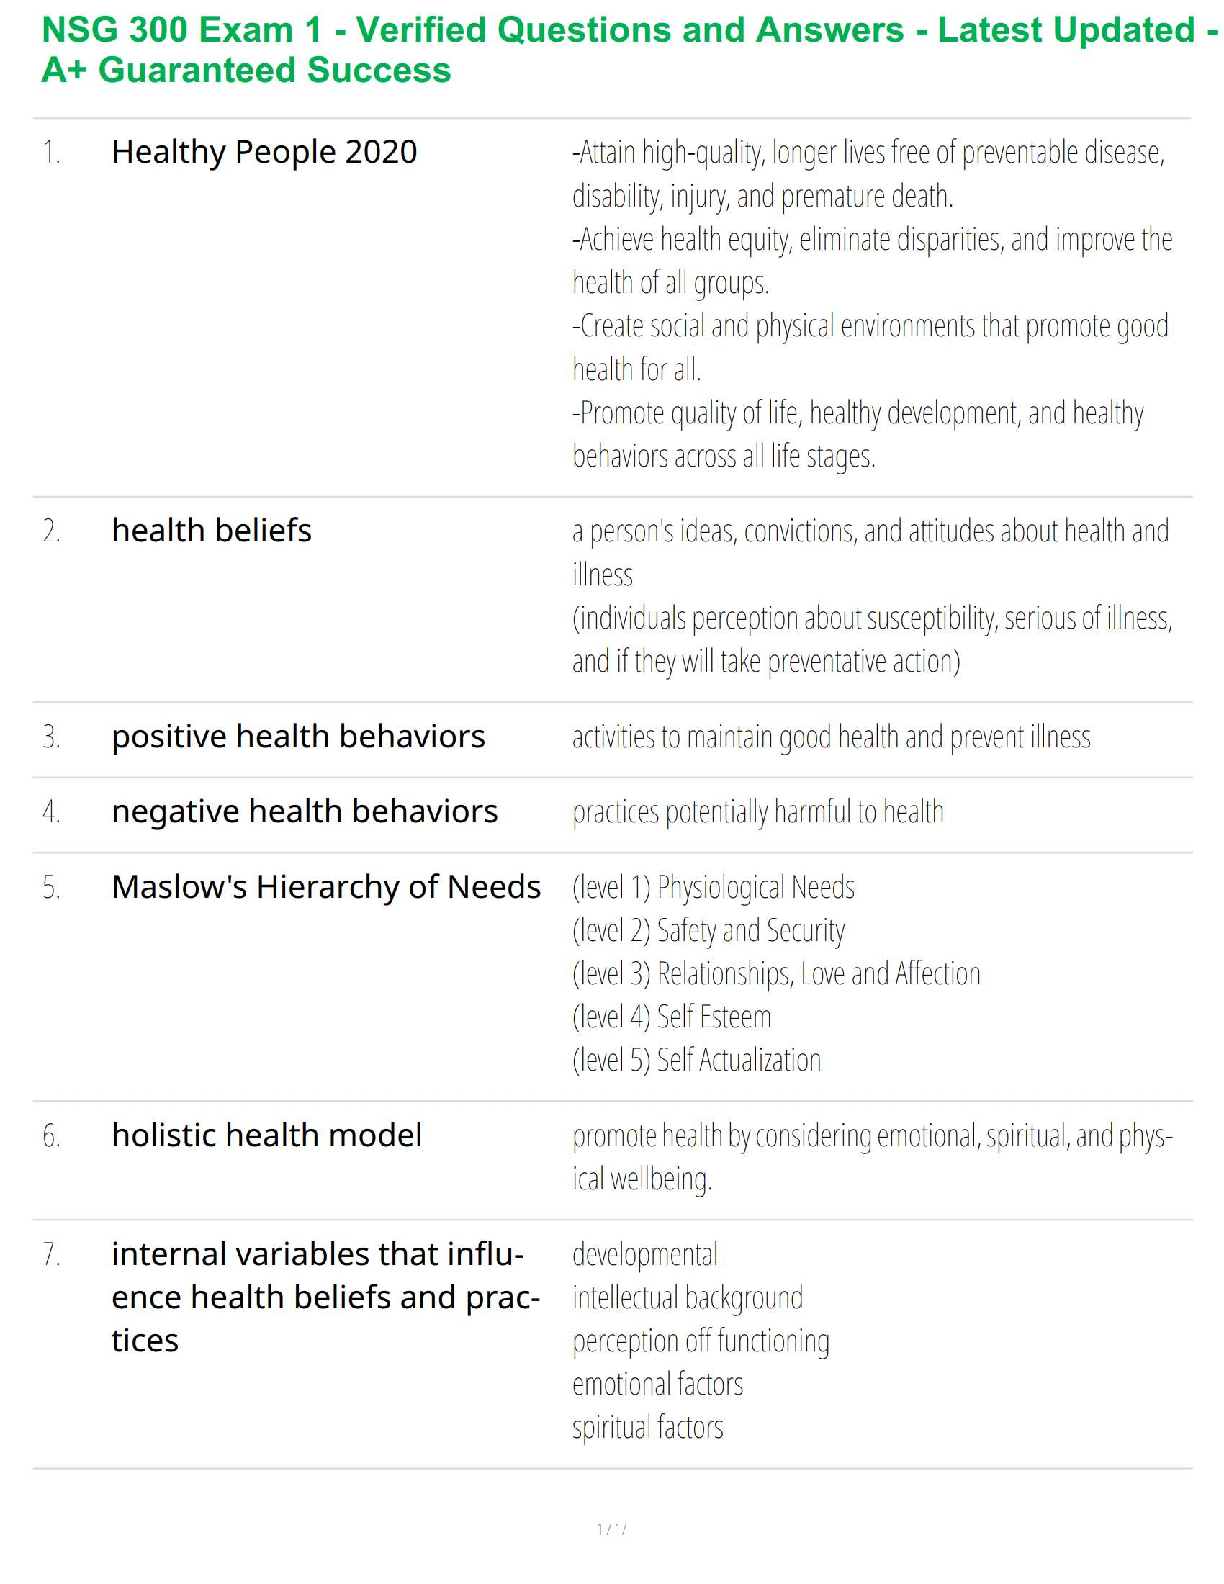
Mary, a javelin thrower, claims that her average throw is 61 meters. During a
practice session, Mary has a sample throw mean of 55.5 meters based on 12
throws. At the 1% significance level, does the data provide suffic
...
Mary, a javelin thrower, claims that her average throw is 61 meters. During a
practice session, Mary has a sample throw mean of 55.5 meters based on 12
throws. At the 1% significance level, does the data provide sufficient evidence to
conclude that Mary's mean throw is less than 61 meters? Accept or reject the
hypothesis given the sample data below.
H0:μ=61 meters ; Ha:μ<61 meters
α=0.01 (significance level)
z0=−1.99
p=0.0233
Well done! You got it right.
Reject the null hypothesis because |−1.99|>0.01 .
Do not reject the null hypothesis because |−1.99|>0.01 .
Reject the null hypothesis because the p -value 0.0233 is greater than the
significance level α=0.01 .
Do not reject the null hypothesis because the value of z is negative.
Do not reject the null hypothesis because the p -value 0.0233 is greater than the
significance level α=0.01 .
Answer Explanation
Correct answer:
Do not reject the null hypothesis because the p -value 0.0233 is greater than the
significance level α=0.01 .
In making the decision to reject or not reject H0 , if α>p -value, reject H0 because
the results of the sample data are significant. There is sufficient evidence to
conclude that H0 is an incorrect belief and that the alternative hypothesis, Ha ,
may be correct. If α≤p -value, do not reject H0 . The results of the sample data are
not significant, so there is not sufficient evidence to conclude that the alternative
hypothesis, Ha , may be correct. In this case, α=0.01 is less than or equal to
p=0.0233 , so the decision is to not reject the null hypoth
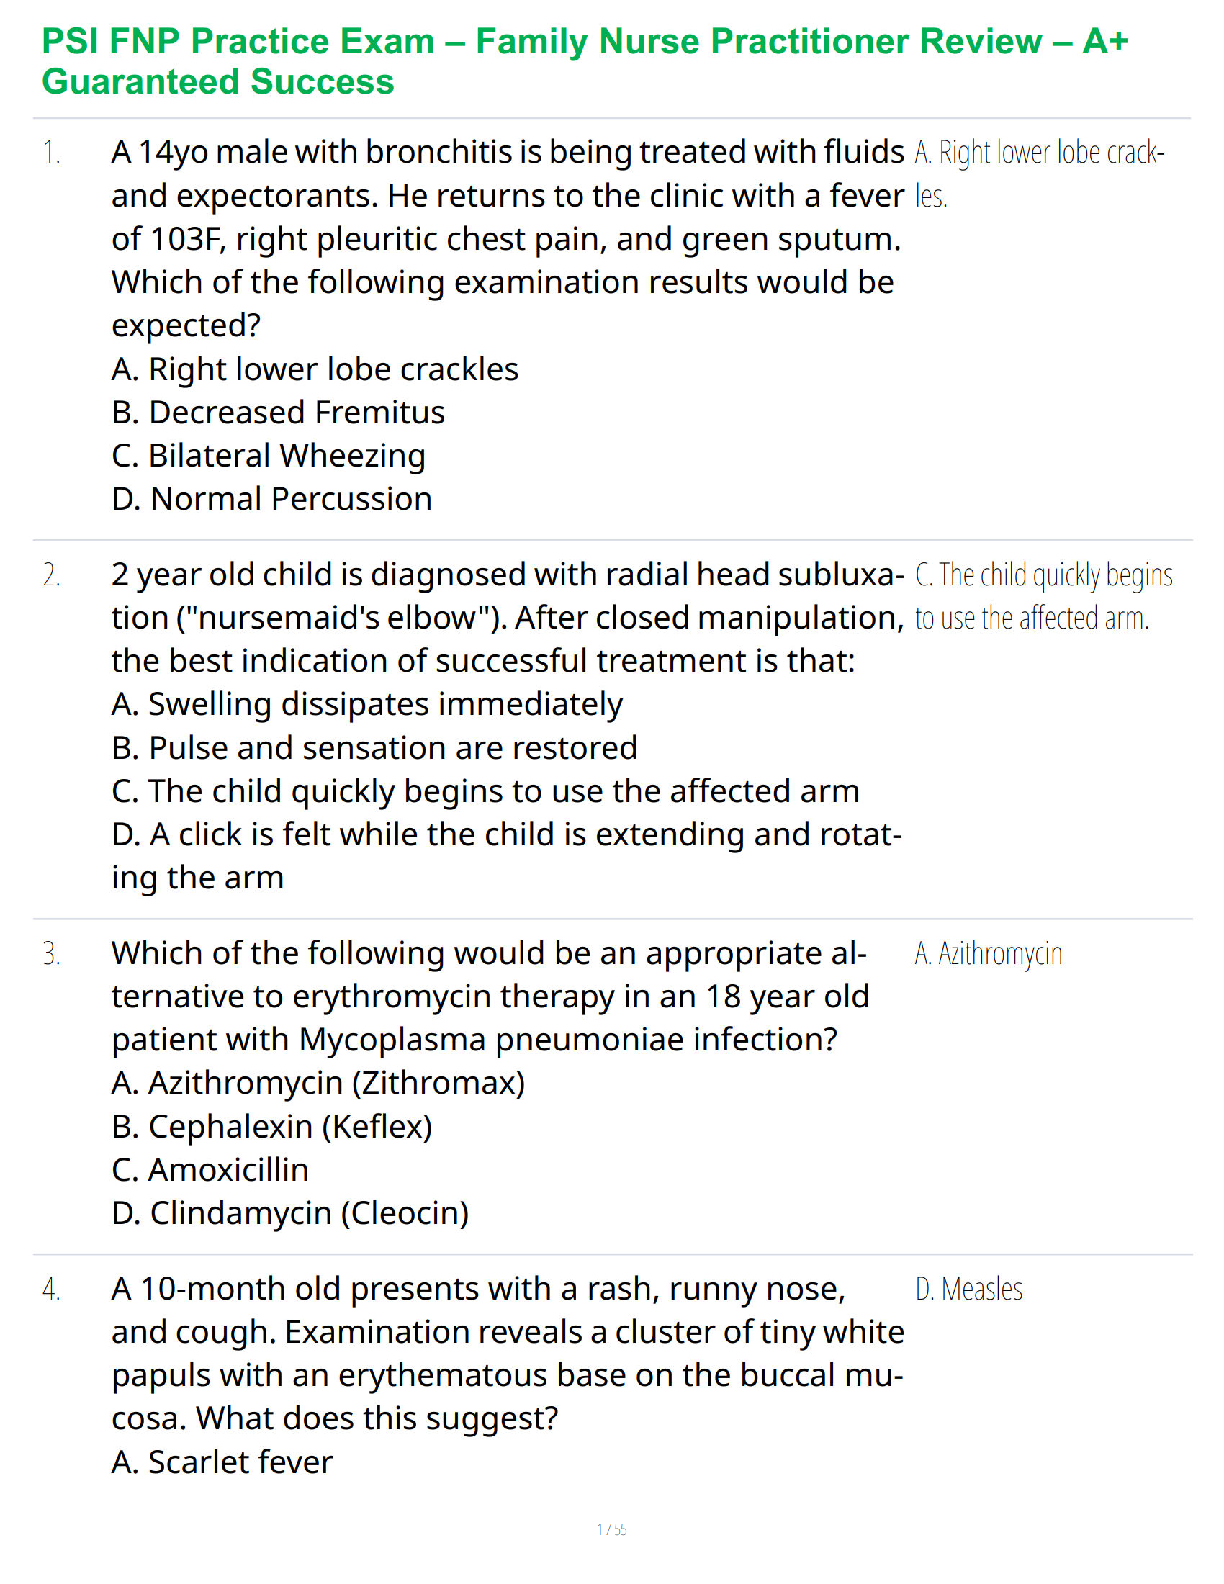
Question
What is the p -value of a two-tailed one-mean hypothesis test, with a test statistic
of z0=−1.73 ? (Do not round your answer; compute your answer using a value
from the table below.)
z−1.8−1.7−1.6−1.5−1.40.000.0360.0450.0550.0670.0810
.010.0350.0440.0540.0660.0790.020.0340.0430.0530.0640.
0780.030.0340.0420.0520.0630.0760.040.0330.0410.0510.
0620.0750.050.0320.0400.0490.0610.0740.060.0310.0390.
0480.0590.0720.070.0310.0380.0470.0580.0710.080.0300.
0380.0460.0570.0690.090.0290.0370.0460.0560.068
Well done! You got it right.
0 point 0 8 4$$0.0840 point 0 8 4 - correct
Correct answers:
Answer Explanation
$$no response given
Correct answers:
00 point 0 8 4$0.084$0.084
The p -value is the probability of an observed value of z=1.73 or greater in
magnitude if the null hypothesis is true, because this hypothesis test is two-tailed.
This means that the p -value could be less than z=−1.73 , or greater than
z=1.73 . This probability is equal to the area under the Standard Normal curve
that lies either to the left of z=−1.73 , or to the right of z=1.73 .
A normal curve is over a horizontal axis and is centered on 0. Two points are
labeled negative 1.73 and 1.72 The area to the right of 1.73 and to the left of
negative 1.73 is shaded.
Using the Standard Normal Table given, we can see that the p -value that
corresponds with z=−1.73 is 0.042 , which is just the area to the left of
z=−1.73 . Since the Standard Normal curve is symmetric, the area to the right of
z=1.73 is 0.042 as well. So, the p -value of this two-tailed one-mean hypothesis
test is (2)(0.042)=0.084 .
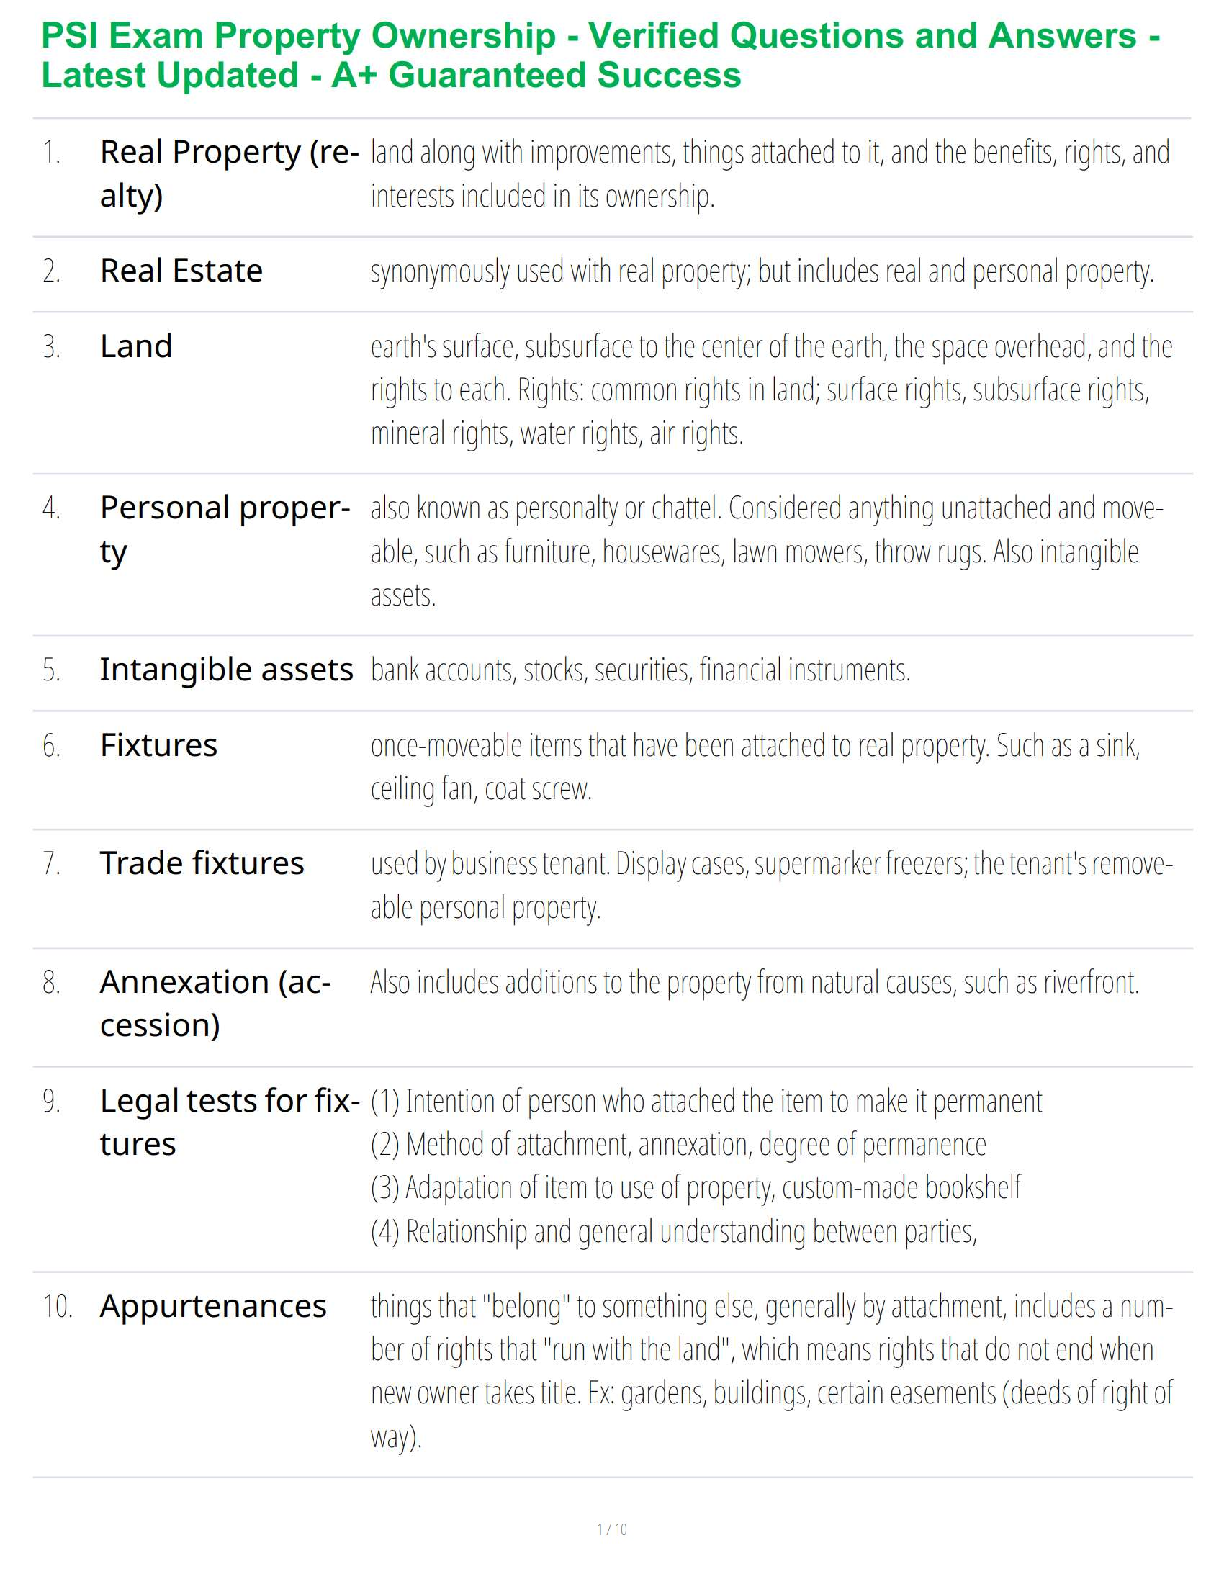
Question
What is the p -value of a two-tailed one-mean hypothesis test, with a test statistic
of z0=0.27 ? (Do not round your answer; compute your answer using a value
from the table below.)
z0.10.20.30.40.50.000.5400.5790.6180.6550.6910.010.54
40.5830.6220.6590.6950.020.5480.5870.6260.6630.6980.0
30.5520.5910.6290.6660.7020.040.5560.5950.6330.6700.70
50.050.5600.5990.6370.6740.7090.060.5640.6030.6410.67
70.7120.070.5670.6060.6440.6810.7160.080.5710.6100.64
80.6840.7190.090.5750.6140.6520.6880.722
Well done! You got it right.
0 point 7 8 8$$0.7880 point 7 8 8 - correct
Correct answers:
Answer Explanation
$$no response given
all questions contains great answers explanations
[Show More]


.png)
.png)