Solution Manual - Mathematical Statistics with Applications 7th edition, Wackerly Chapter 1: What is Statistics?
1.1 a. Population: all generation X age US citizens (specifically, assign a ‘1’ to those who
want to star
...
Solution Manual - Mathematical Statistics with Applications 7th edition, Wackerly Chapter 1: What is Statistics?
1.1 a. Population: all generation X age US citizens (specifically, assign a ‘1’ to those who
want to start their own business and a ‘0’ to those who do not, so that the population is
the set of 1’s and 0’s). Objective: to estimate the proportion of generation X age US
citizens who want to start their own business.
b. Population: all healthy adults in the US. Objective: to estimate the true mean body
temperature
c. Population: single family dwelling units in the city. Objective: to estimate the true
mean water consumption
d. Population: all tires manufactured by the company for the specific year. Objective: to
estimate the proportion of tires with unsafe tread.
e. Population: all adult residents of the particular state. Objective: to estimate the
proportion who favor a unicameral legislature.
f. Population: times until recurrence for all people who have had a particular disease.
Objective: to estimate the true average time until recurrence.
g. Population: lifetime measurements for all resistors of this type. Objective: to estimate
the true mean lifetime (in hours).
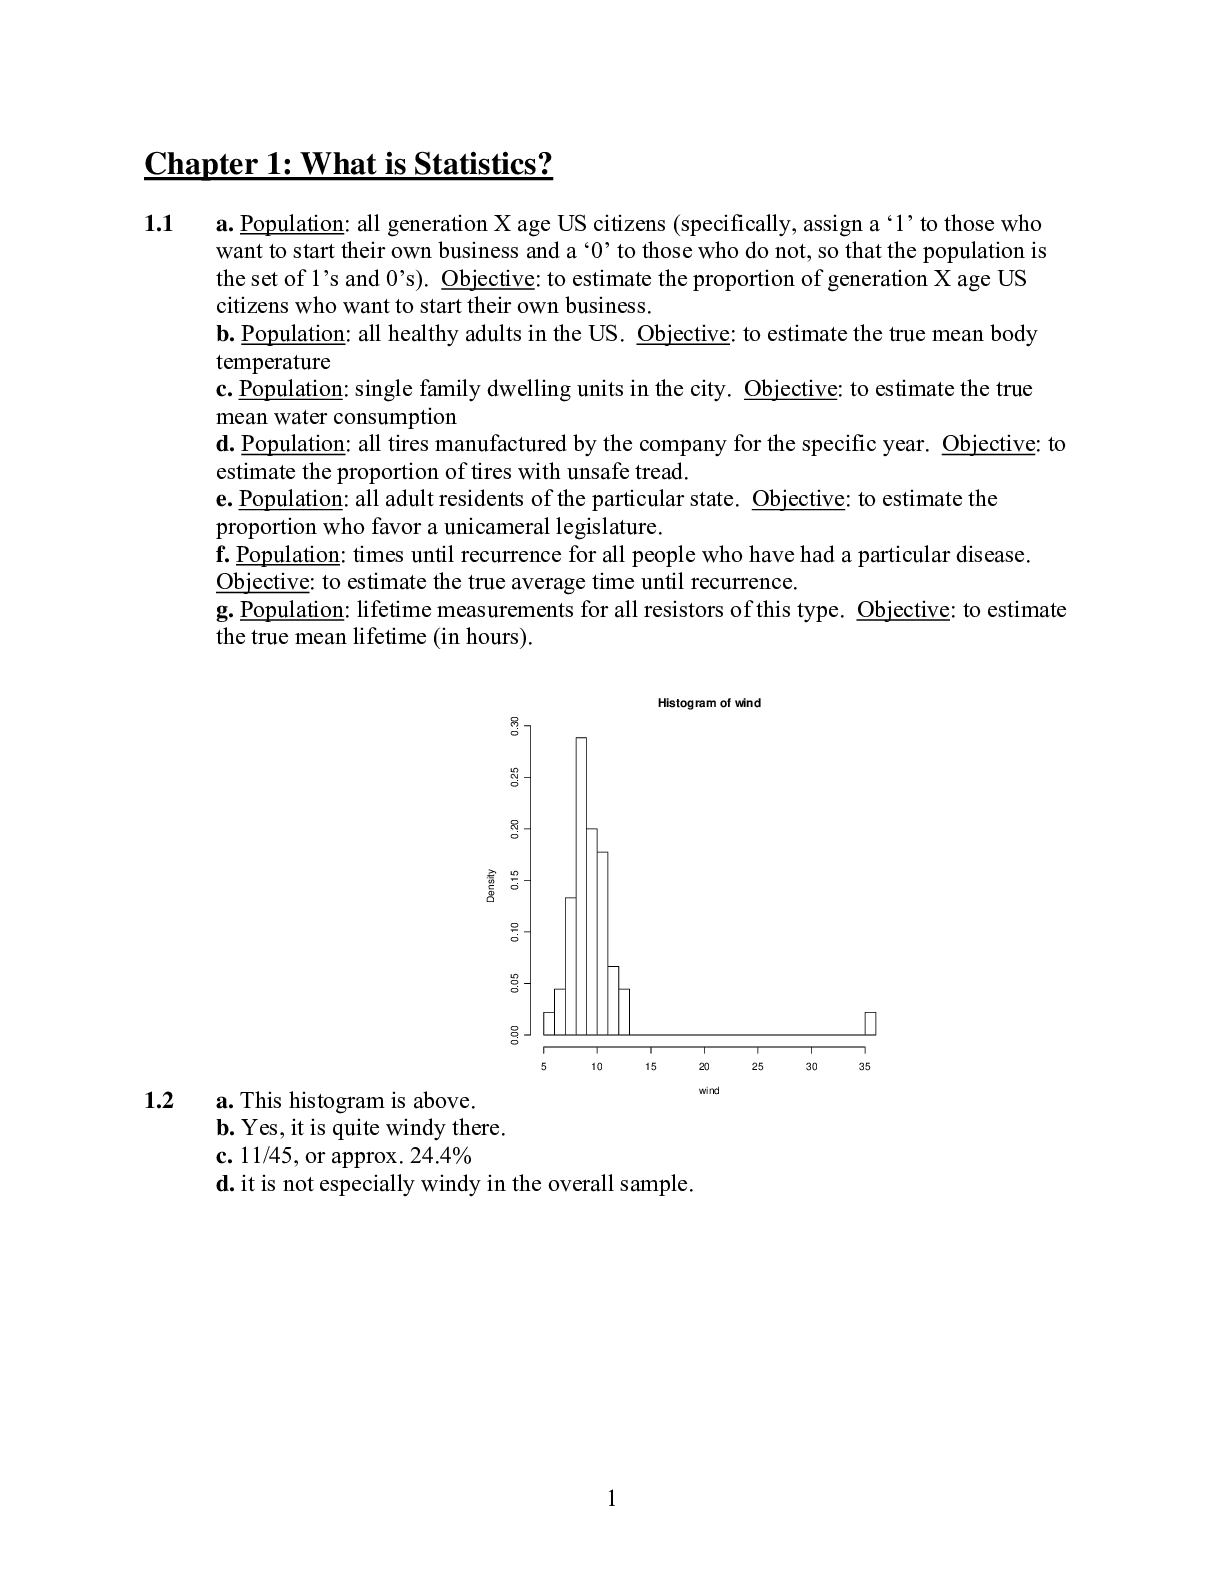
1.2 a. This histogram is above.
Histogram of wind
wind
Density
5 10 15 20 25 30 35
0.00 0.05 0.10 0.15 0.20 0.25 0.30
b. Yes, it is quite windy there.
c. 11/45, or approx. 24.4%
d. it is not especially windy in the overall sample.
2 Chapter 1: What is Statistics?
Instructor’s Solutions Manual
1.3 The histogram is above.
Histogram of U235
U235
Density
0 2 4 6 8 10 12
0.00 0.05 0.10 0.15 0.20 0.25
1.4 a. The histogram is above.
Histogram of stocks
stocks
Density
2 4 6 8 10 12
0.00 0.05 0.10 0.15 0.20 0.25 0.30
b. 18/40 = 45%
c. 29/40 = 72.5%
1.5 a. The categories with the largest grouping of students are 2.45 to 2.65 and 2.65 to 2.85.
(both have 7 students).
b. 7/30
c. 7/30 + 3/30 + 3/30 + 3/30 = 16/30
1.6 a. The modal category is 2 (quarts of milk). About 36% (9 people) of the 25 are in this
category.
b. .2 + .12 + .04 = .36
c. Note that 8% purchased 0 while 4% purchased 5. Thus, 1 – .08 – .04 = .88 purchased
between 1 and 4 quarts.
Chapter 1: What is Statistics? 3
Instructor’s Solutions Manual
1.7 a. There is a possibility of bimodality in the distribution.
b. There is a dip in heights at 68 inches.
c. If all of the students are roughly the same age, the bimodality could be a result of the
men/women distributions.
[Show More]


 for Linear Algebra and Its Applications (Thomas Polaski, Judith McDonald -David C.png)