Pump Performance
Document Content and Description Below
Pump Performance
Pump Performance
1. Determine the transducer voltage bias average value from the data file. Include the 95%
CI for this value.
95% CI = 2.82*10-5
2. Test Pump 1. See procedure in lab manual. Complet
...
[Show More]
Last updated: 3 years ago
Preview 1 out of 7 pages
Instant download

Buy this Document to get the Full Access Instantly
Provided by students Who Aced it
We verify Information Content to Gurantee Success
Reviews( 0 )
Document information
Connected school, study & course
About the document
Uploaded On
Oct 24, 2022
Number of pages
7
Written in
All

Additional information
This document has been written for:
Uploaded
Oct 24, 2022
Downloads
0
Views
164
Document Keyword Tags
Recommended For You
Get more on Quiz »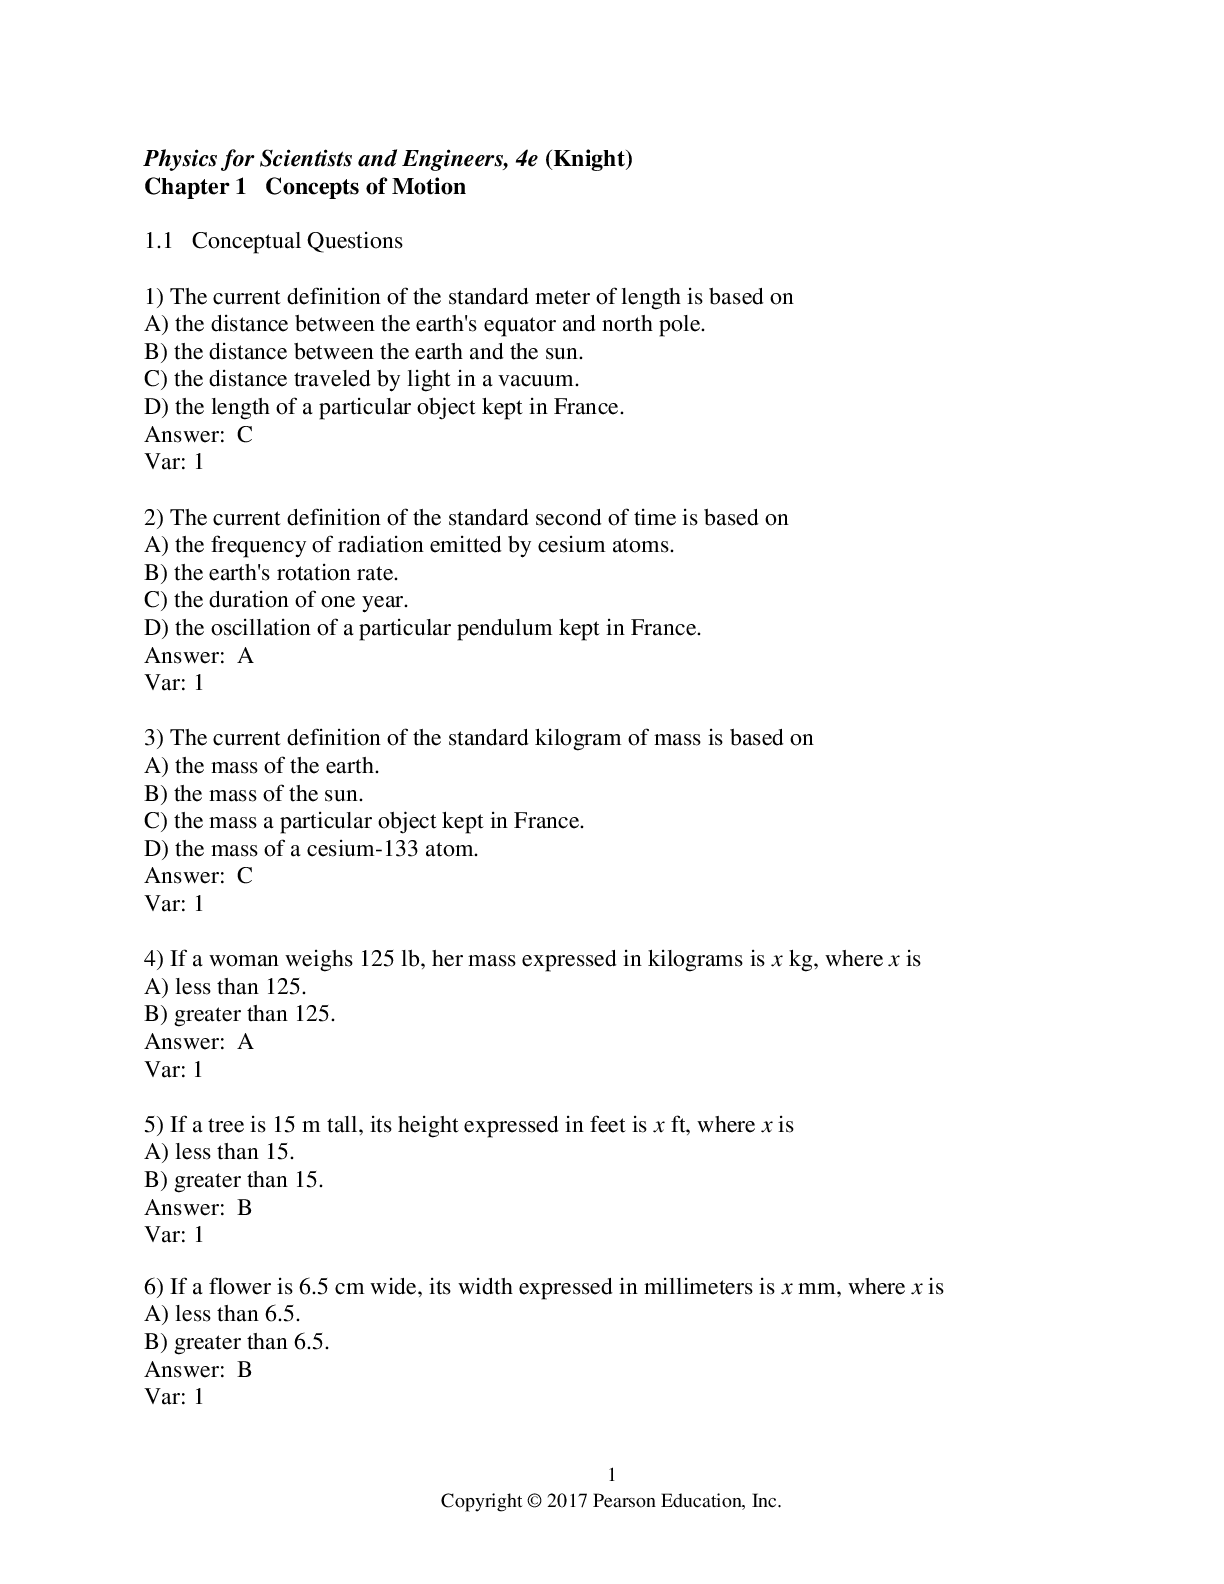
$22
713 Pages
Test Bank for Physics for Scientists and Engineers A Strategic...

$25
100 Pages
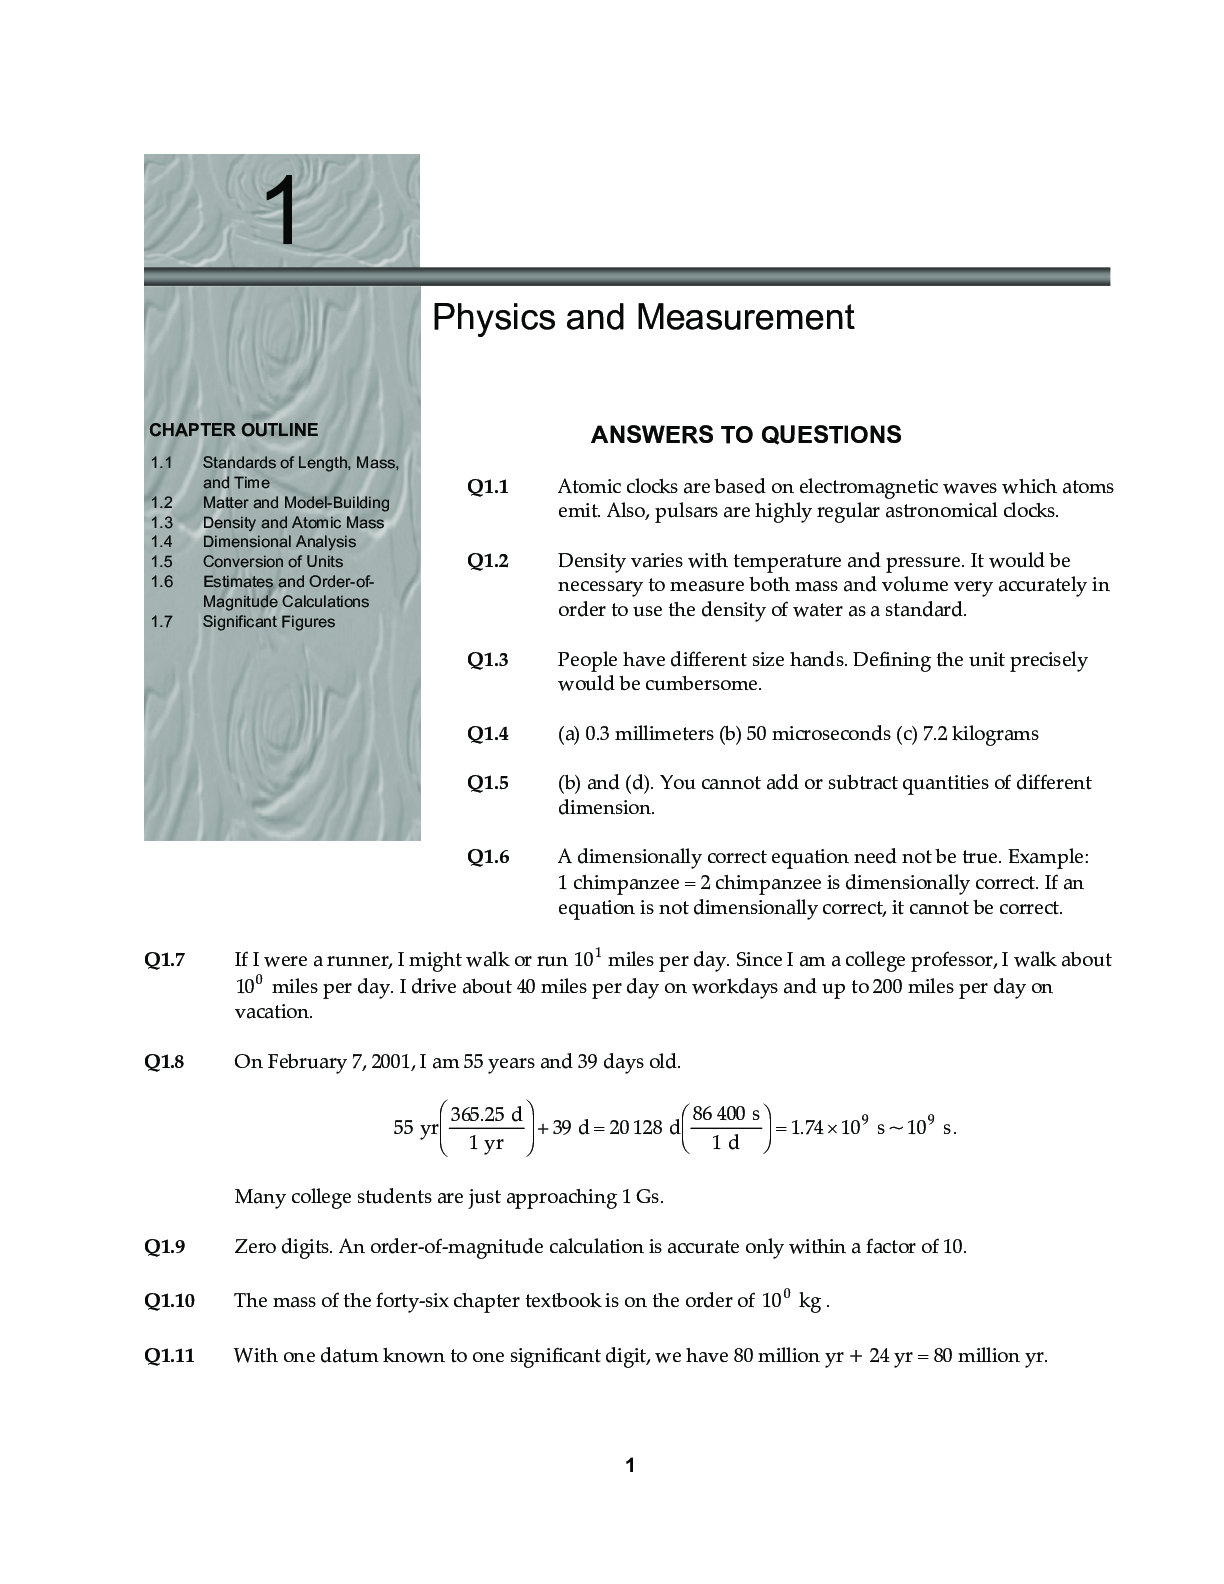
Plasma Physics, 2e by Richard Fitzpatrick (Solutions Manual)

$25
37 Pages
College Physics, 3e Roger Freedman, Todd Ruskell, Philip Keste...

$25
79 Pages
A Concise Introduction to Thermodynamics for Physicists, 1e by...
$23
1305 Pages
Physics for Scientists and Engineers by Raymond Serway | SOLUT...
$22
1305 Pages
SOLUTIONS MANUAL for Physics for Scientists and Engineers by R...
$19
1305 Pages
Physics for Scientists and Engineers by Raymond A. Serway | SO...
$18.5
13 Pages
United States University FNP 593: All Quizzes | Complete Quest...
$15.5
20 Pages


