BSTAT 3321 Practice Final Exam
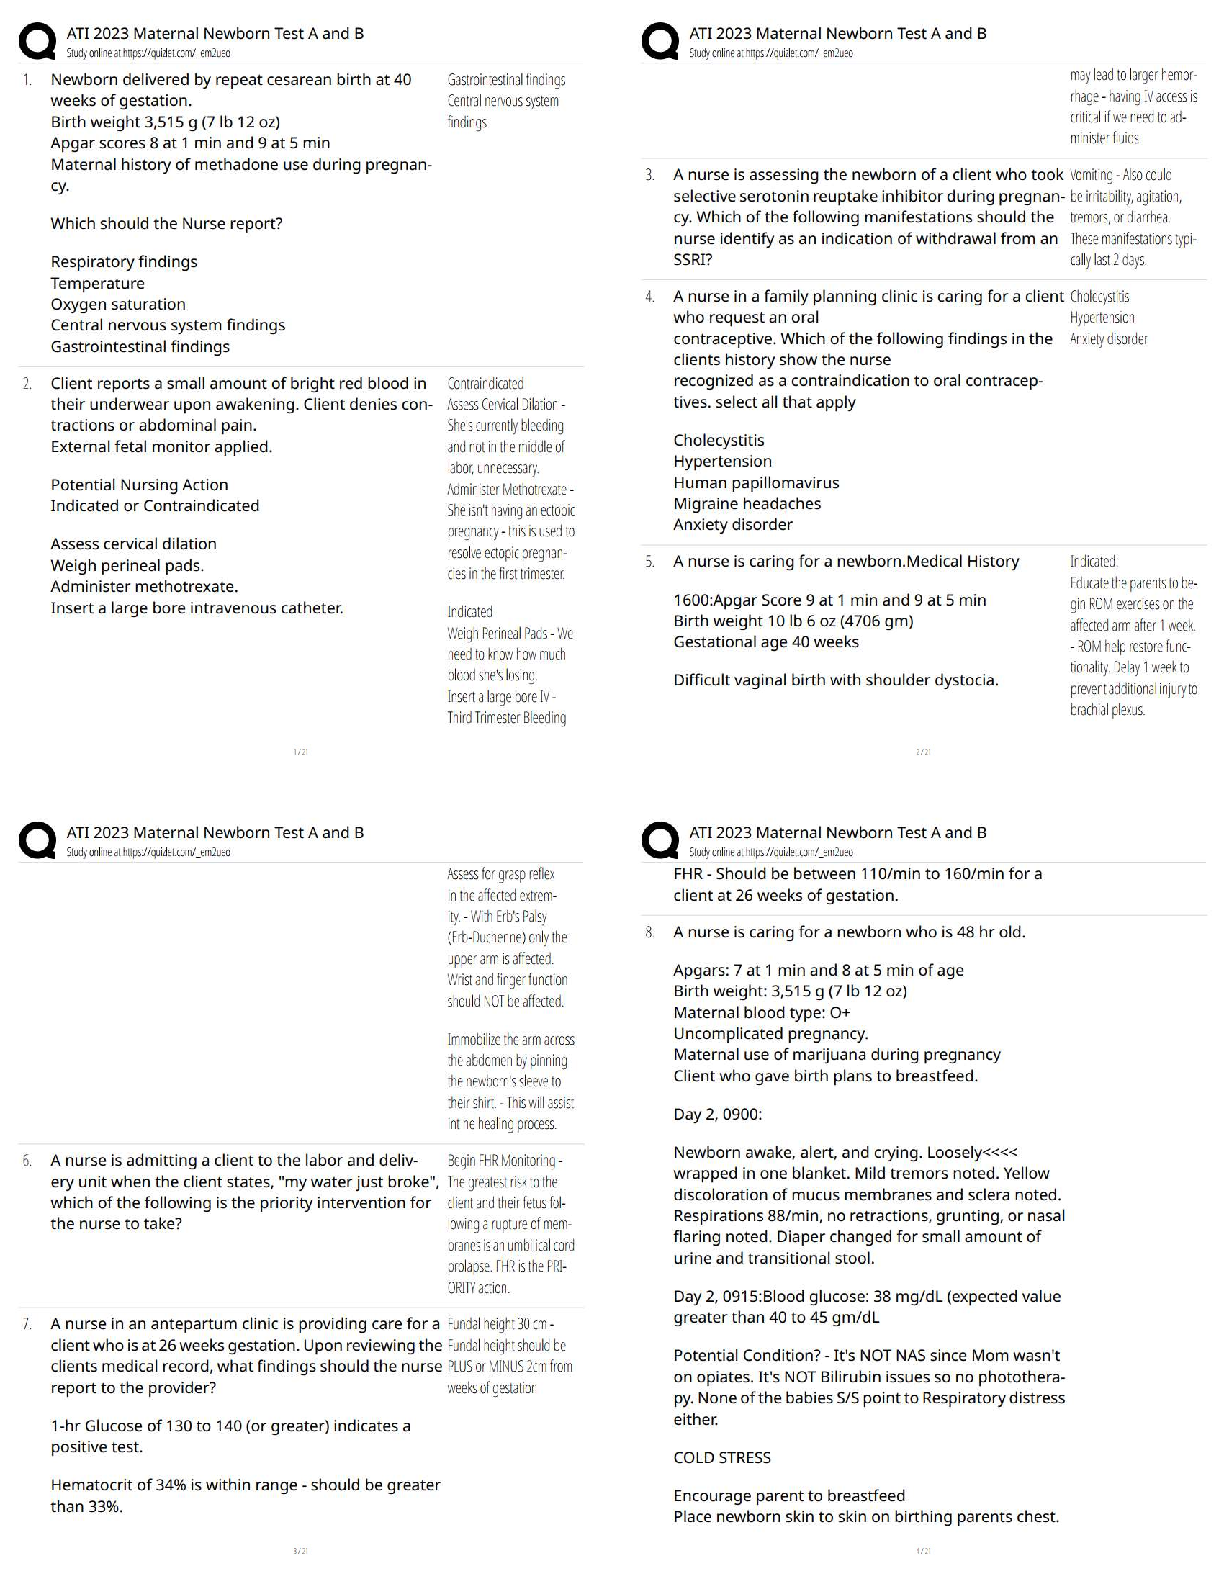
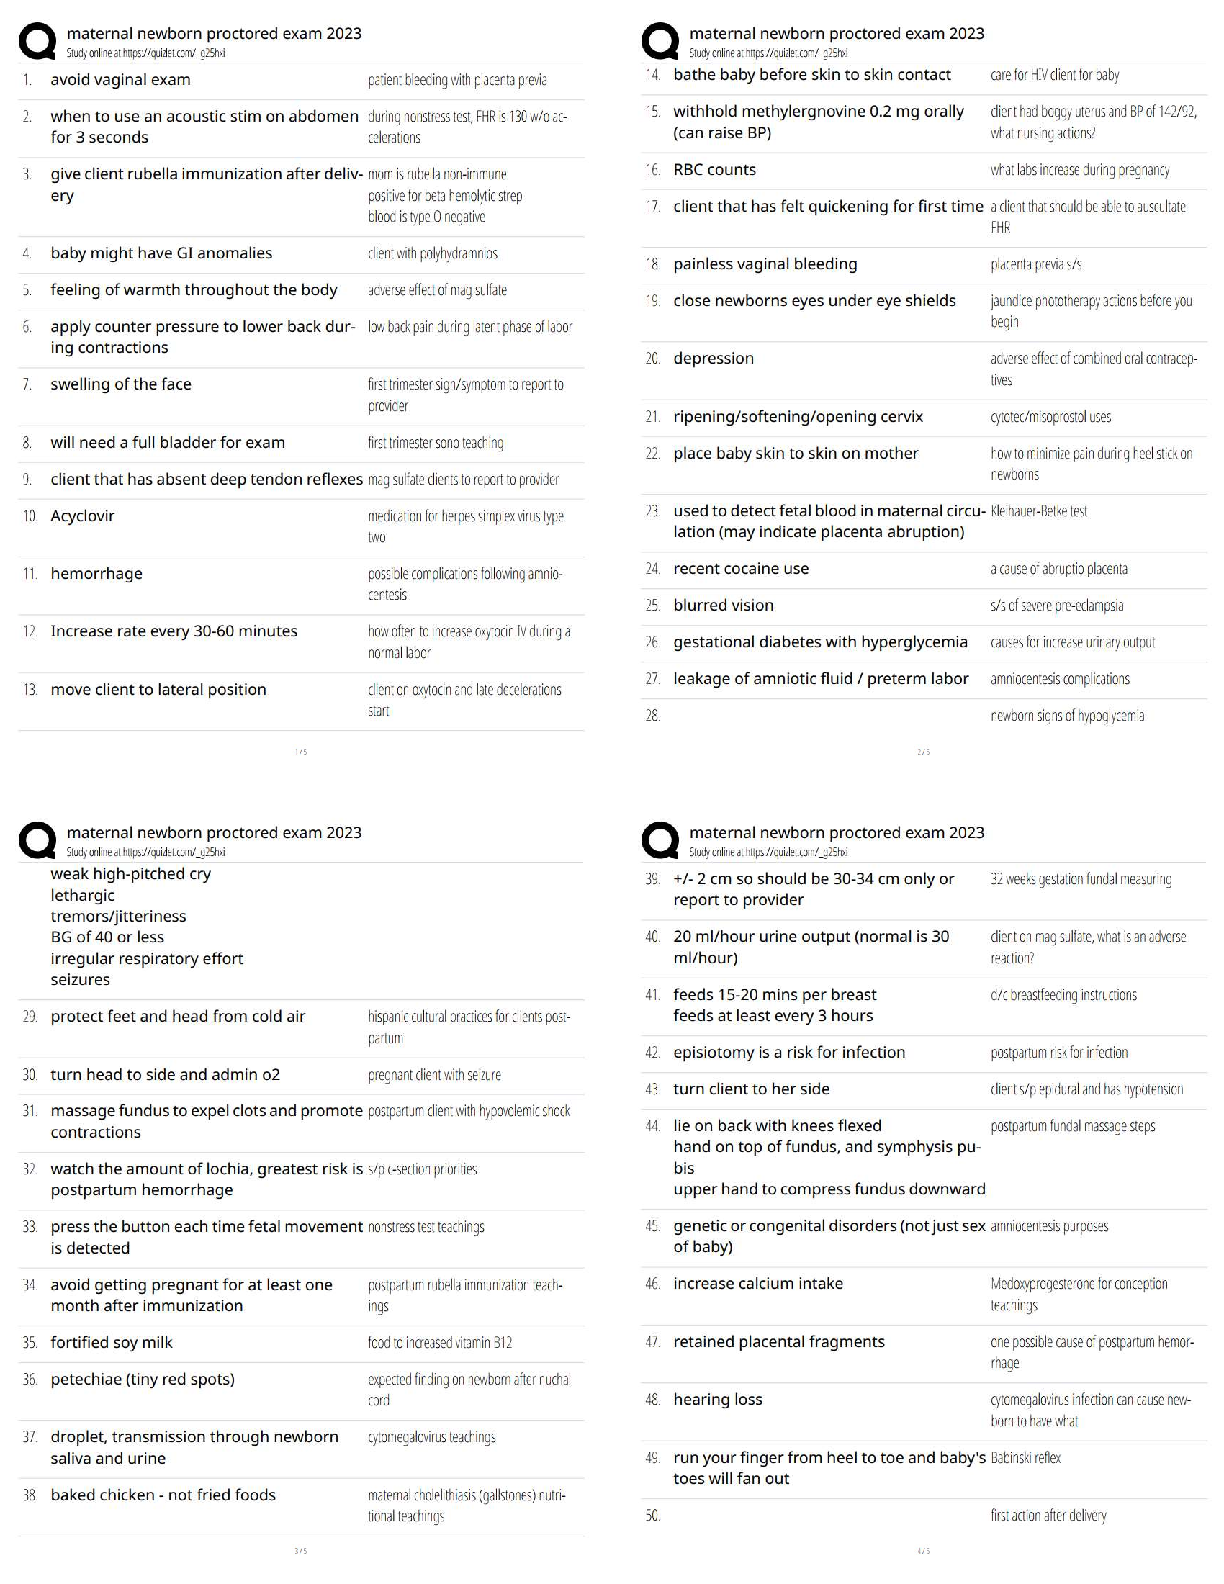
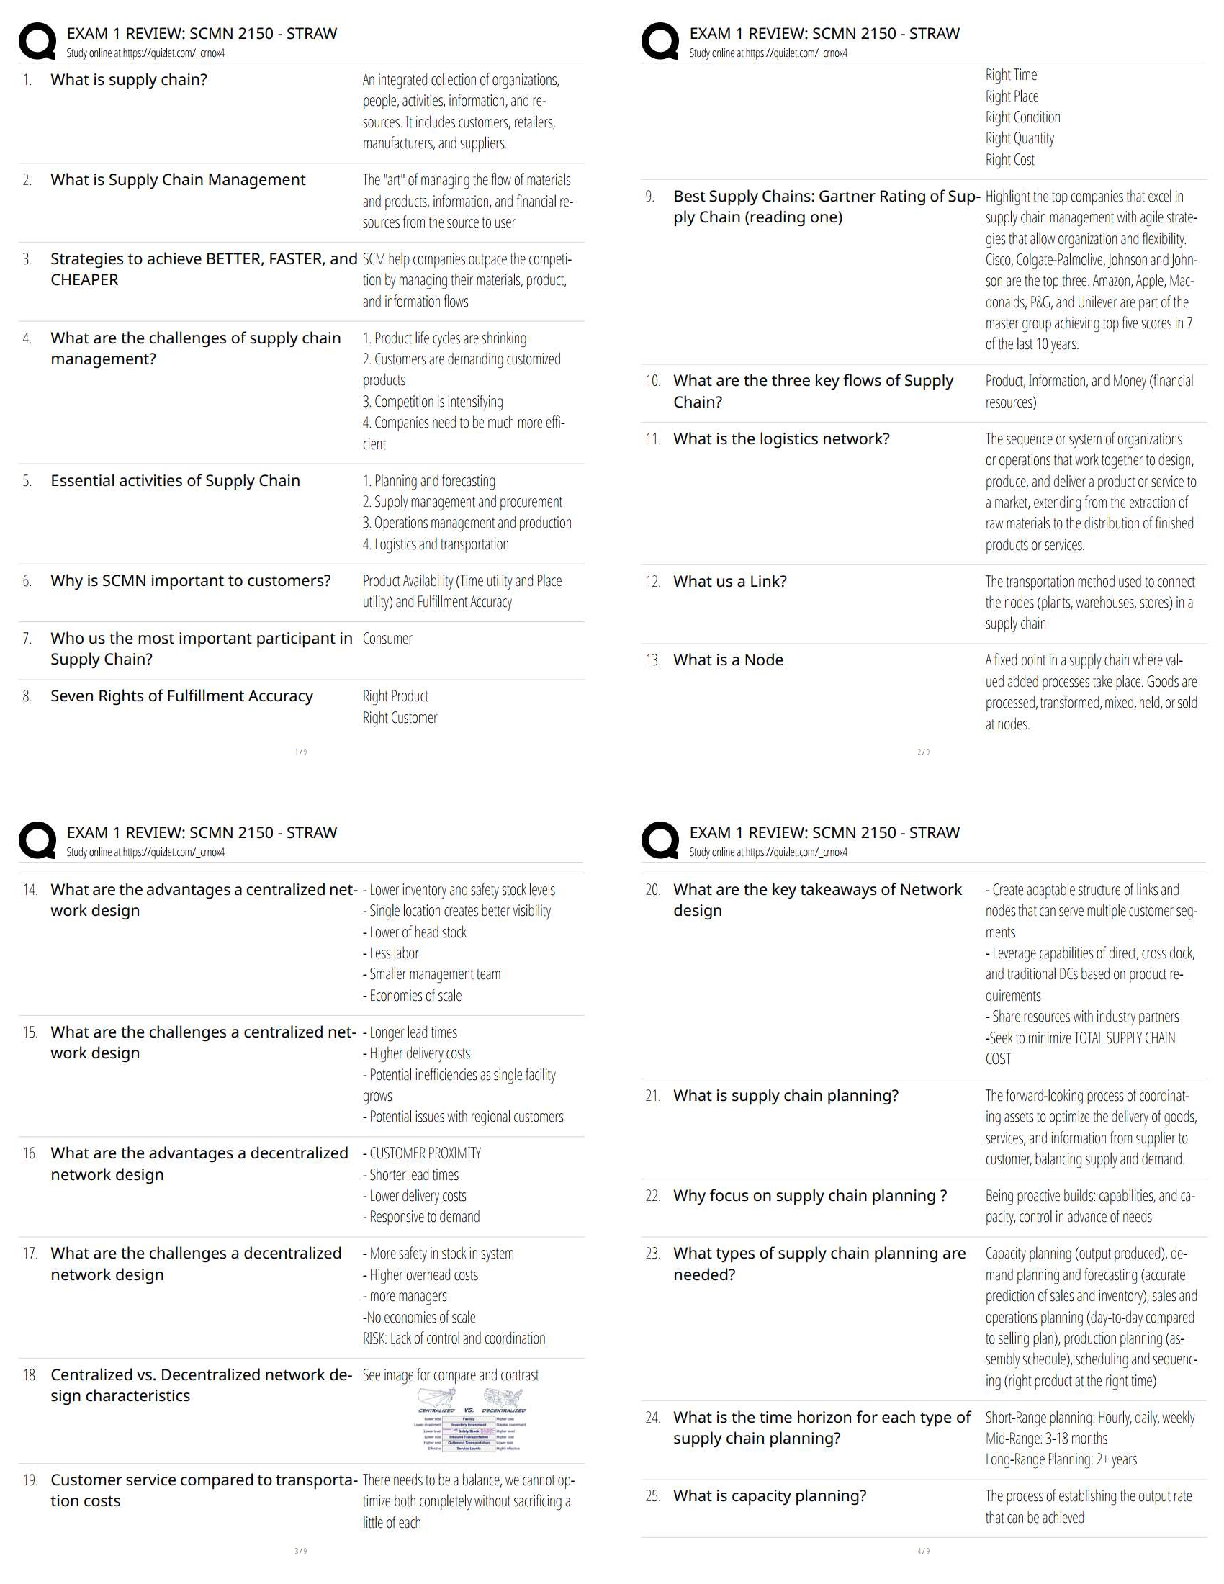
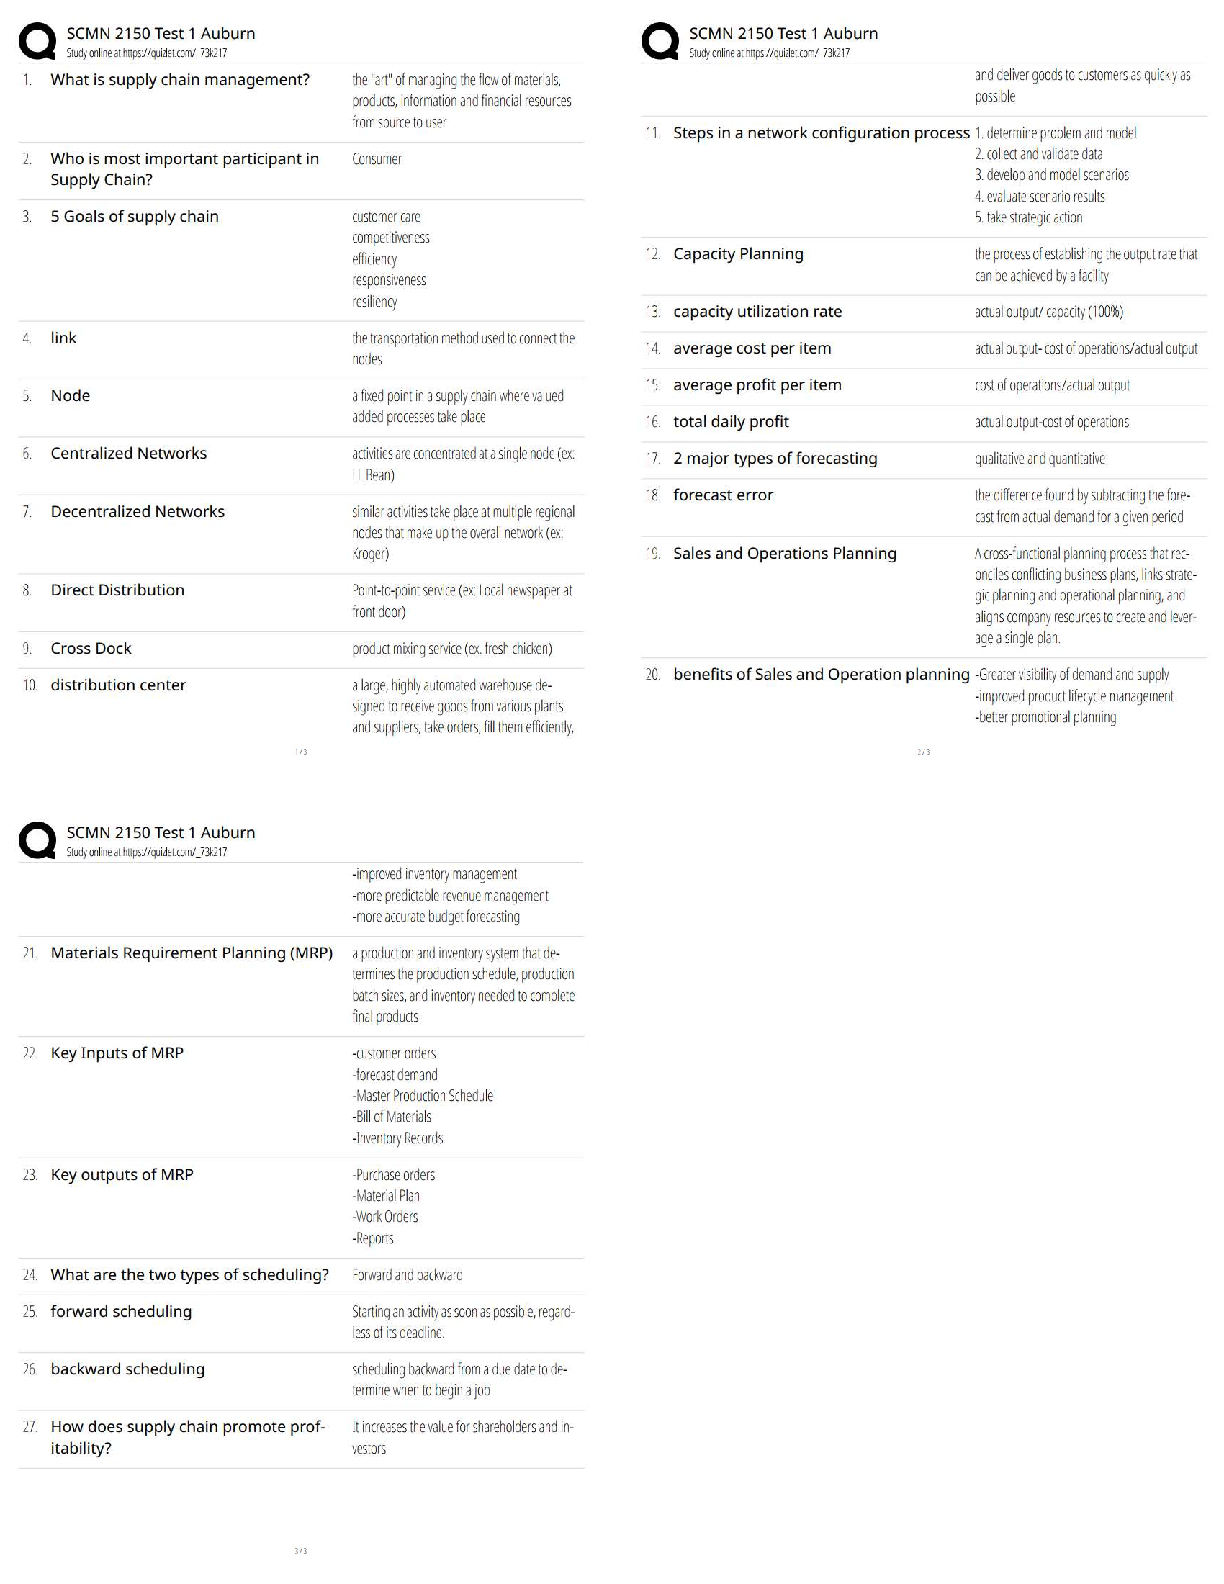
1. The two graphical techniques we usually use to present nominal data are
a. bar chart and histogram
b. pie chart and ogive
c. bar chart and pie chart
d. histogram and ogive
2. Which
...
BSTAT 3321 Practice Final Exam
1. The two graphical techniques we usually use to present nominal data are
a. bar chart and histogram
b. pie chart and ogive
c. bar chart and pie chart
d. histogram and ogive
2. Which of the following are deceptive practices
a. Using a pie chart instead of a bar chart
b. Using a bar chart instead of a line graph
c. Showing only absolute changes in value with a truncated vertical
axis
d. All of the above are deceptive
3. In a positively-skewed distribution,
a. the median equals the mean
b. the median is less than the mean
c. the median is larger than the mean
d. the mean, median, and mode are equal
4. The Empirical Rule states that the percentage of measurements in a data
set (providing that the data set has a bell-shaped distribution) that fall
within two standard deviations of their mean is approximately:
a. 68%
b. 75%
c. 95%
d. 99.7%
5. Which of the following statements is true for the following data values:
7, 5, 6, 4, 7, 8, and 12?
a. The mean, median and mode are all equal
b. Only the mean and median are equal
c. Only the mean and mode are equal
d. Only the median and mode are equal
6. Which of the following sampling plans does not use random methods
of selections?
a. Simple random sampling.
b. Stratified random sampling.
c. Random cluster sampling.
d. Self- selected opinion poll. (SLOP)
This study source was downloaded by 100000831988016 from CourseHero.com on 03-26-2022 02:51:55 GMT -05:00
https://www.coursehero.com/file/52120169/BSTAT-3321-Practice-Final-Exam-Fall-2019-1doc/
7. If two events are mutually exclusive, what is the probability that both occur
at the same time?
a. 0.00
b. 0.50
c. 1.00
d. Cannot be determined from the information given.
8. If A and B are independent events with P(A) = 0.20 and P(B) = 0.60,
then P(A|B) is:
a. 0.20
b. 0.60
c. 0.40
d. 0.80
9. The number of fans at a Cowboy’s game over a given time interval is an
example of a(n) __________ random variable. The length of the game
in minutes is an example of a(n) _________random variable.
a. Exponential; Poisson
b. Continuous; discrete
c. Discrete; Continuous
d. None of the above
10. The probability of 3 or fewer heads in 10 tosses of an unbiased coin is
a. .117
b. .883
c. .172
d. None of the above
11.Airlines always overbook because of no shows. The probability of a no
show for a reservation is .10. If a flight has 100 reservations, what is
the expected number of passengers who will actually show up? What
is the variance of the number of passengers who actually show up?
a. 10,100
b. 90, 9
c. 10, 9
d. None of the above
12. Given that the random variable X is normally distributed with a mean of
75 and a standard deviation of 5, P (65 30
b. is approximately normal if n < 30
c. is approximately normal if the underlying population is normal
d. has the same variance as the population
16. Suppose that student debt for students at UTA follows a positively skewed
distribution with mean of $9,000 and a standard deviation of $3,000. If
30 students are randomly sampled, which statement about the
sampling distribution of the sample mean is not true
a. The expected value of the sampling distribution of the sample mean
is $9,000
b. The standard error of the sampling distribution of the sample mean
is $547.72
c. The shape of the sampling distribution of the sample mean is
approximately normal
d. None of the above
17. A sample of 250 observations will be selected at random from an
infinite population. Given that the population proportion is .25, the
standard error of the sampling distribution of the sample proportion is:
a. 0.0274
b. 0.5000
c. 0.0316
d. 0.0548
This study source was downloaded by 100000831988016 from CourseHero.com on 03-26-2022 02:51:55 GMT -05:00
https://www.coursehero.com/file/52120169/BSTAT-3321-Practice-Final-Exam-Fall-2019-1doc/
18. The criterion for using the normal distribution to approximate the sampling
distribution of the sample proportion is
a. n > 30
b. n* > 5 and n*(1-) > 5
c. Either of the above
d. Both of the above
19. A 98% confidence interval estimate for a population mean is
determined to be 75.38 to 86.52. If the confidence level is reduced to
90%, the confidence interval for
a. becomes wider
b. remains the same
c. becomes narrower
d. None of the above.
20.To estimate with 99% confidence the mean of a normal population, whose
standard deviation is assumed to be 6 and the maximum allowable
sampling error is assumed to be 1.2, requires a random sample of size
a. 166
b. 165
c. 164
d. 163
21. Under which of the following circumstances is it impossible to construct
a confidence interval for the population mean?
a. A non-normal population with a large sample and an unknown
population variance
b. A normal population with a large sample and a known population
variance
c. Non-normal population with a small sample and an unknown
population variance
d. A normal population with a small sample and an unknown
population variance
22. A confidence interval was used to estimate the proportion of
international students. A random sample of 72 students generated the
following 90% confidence interval: (0.438, 0.642). Using the
information above, what size sa
[Show More]
.png)


.png)