Electronics > Lab Report > ELET 2105Lab Report 4. (All)
ELET 2105Lab Report 4.
Document Content and Description Below
Last updated: 3 years ago
Preview 1 out of 19 pages
Instant download

Buy this Document to get the Full Access Instantly
Provided by Students Who Aced it
We Verify Document Content to Gurantee Accuracy
Reviews( 0 )
Document information
Connected school, study & course
About the document
Uploaded On
Sep 01, 2021
Number of pages
19
Written in
All

Additional information
This document has been written for:
Uploaded
Sep 01, 2021
Downloads
0
Views
137
Document Keyword Tags
Recommended For You
Get more on Lab Report »
Fundamentals of Semiconductor Devices 1e Richard Anderson, Bet...


Electronics Fundamentals Circuits, Devices & Applications, 8e...
Solution Manual For Electronic Devices, Global Edition, 10th E...
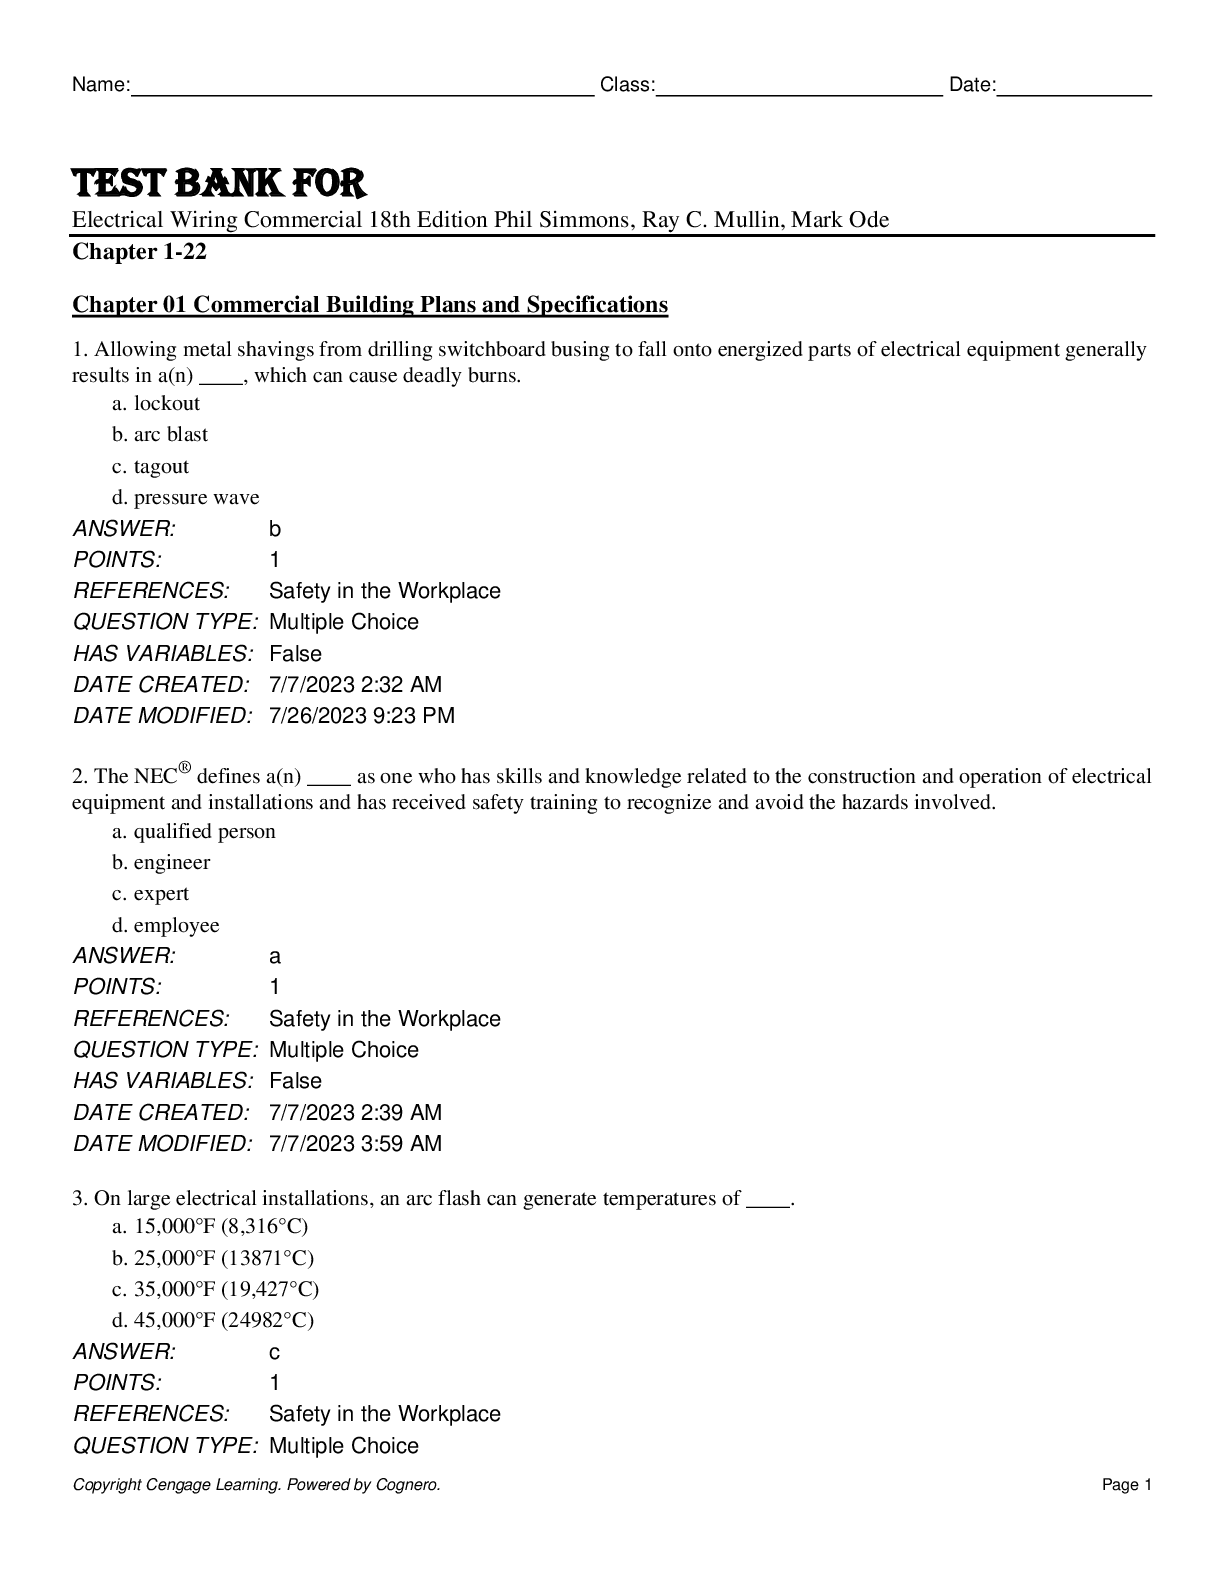
Test Bank For Electrical Wiring Commercial 18th Edition by Phi...
SOLUTIONS MANUAL AND ANSWER GUIDE TO THE NATIONAL ELECTRICAL C...

Solutions Manual to Optoelectronics and Photonics: Principles...

SOLUTIONS MANUAL Electronic Principles 9th Edition by Albert P...
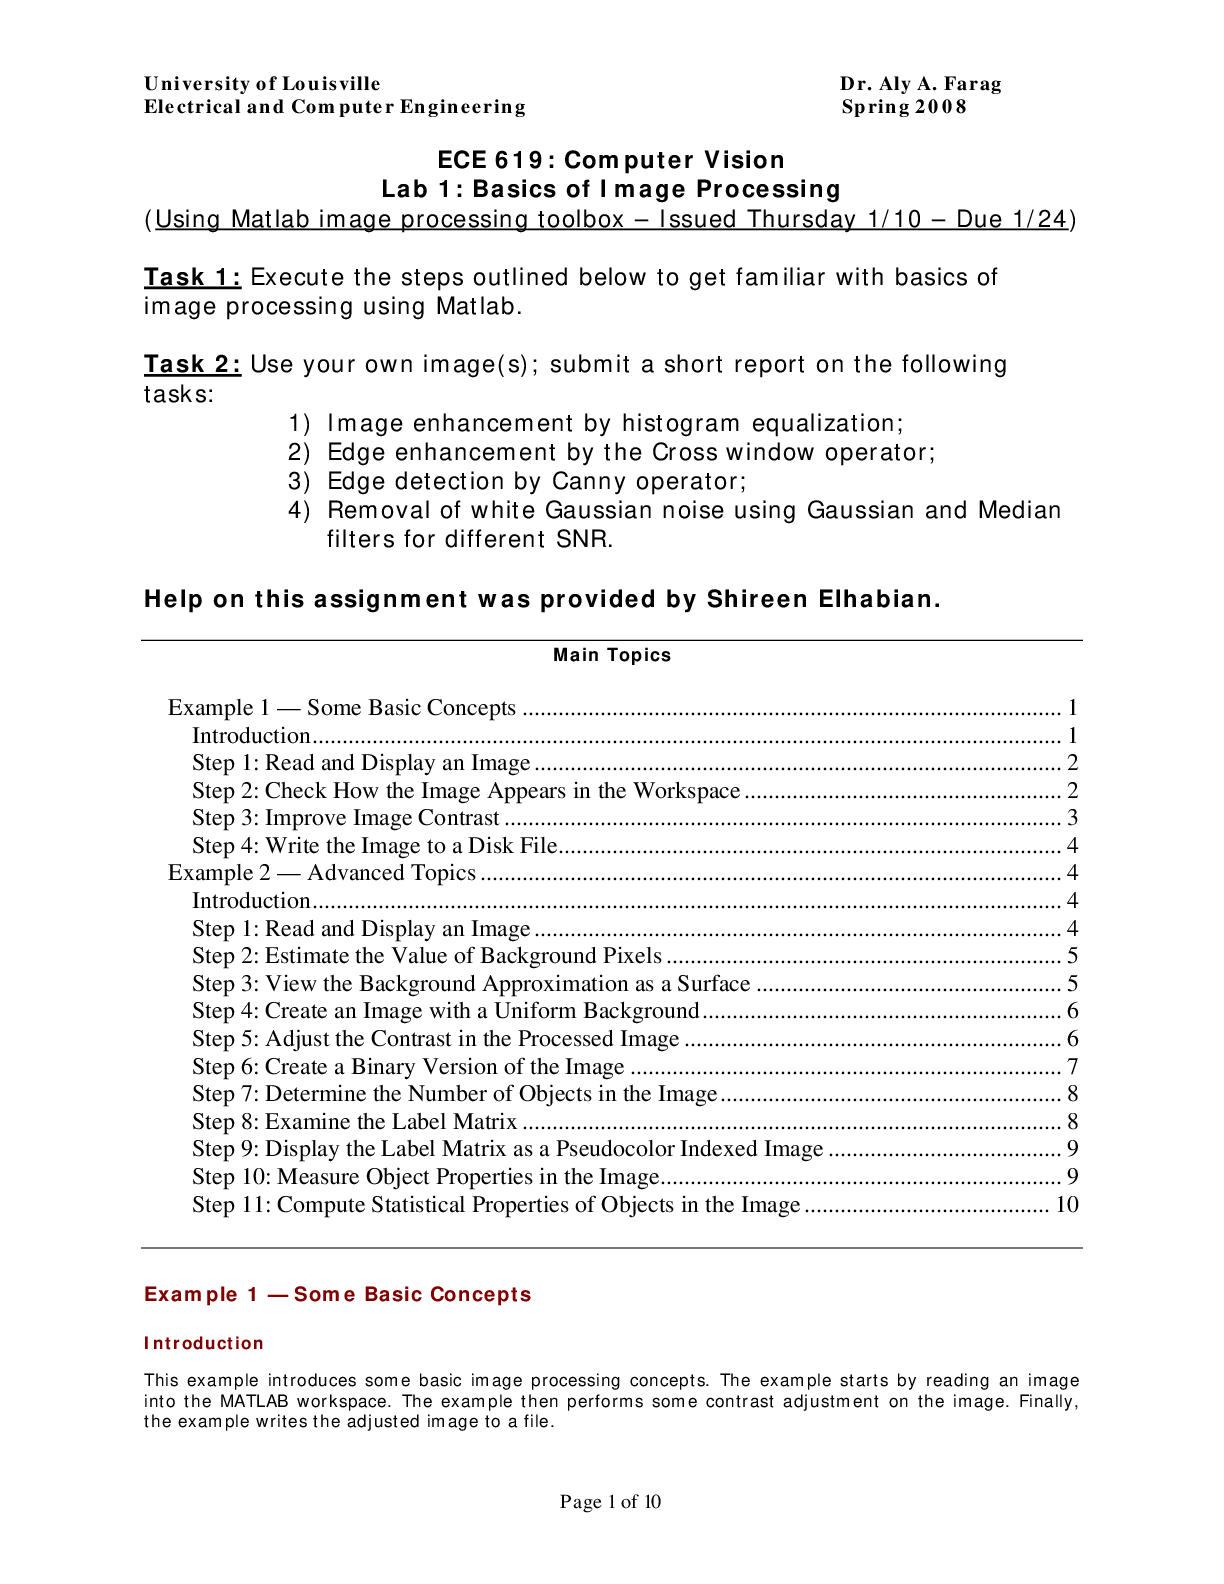
University of Louisville ECE 619 Computer Vision Lab 1 - Basic...


Frequency Response of Transistor Amplifiers Lab Report ( WELL...

Bipolar Junction Transistor Differential Amplifiers Sixth Repo...

DLD LAB EXP 05(Design of a 1 bit comparator block using basic...


.png)
