Complete Solutions Manual for Econometrics, 4th Edition by Badi H. Baltagi
$ 28.5
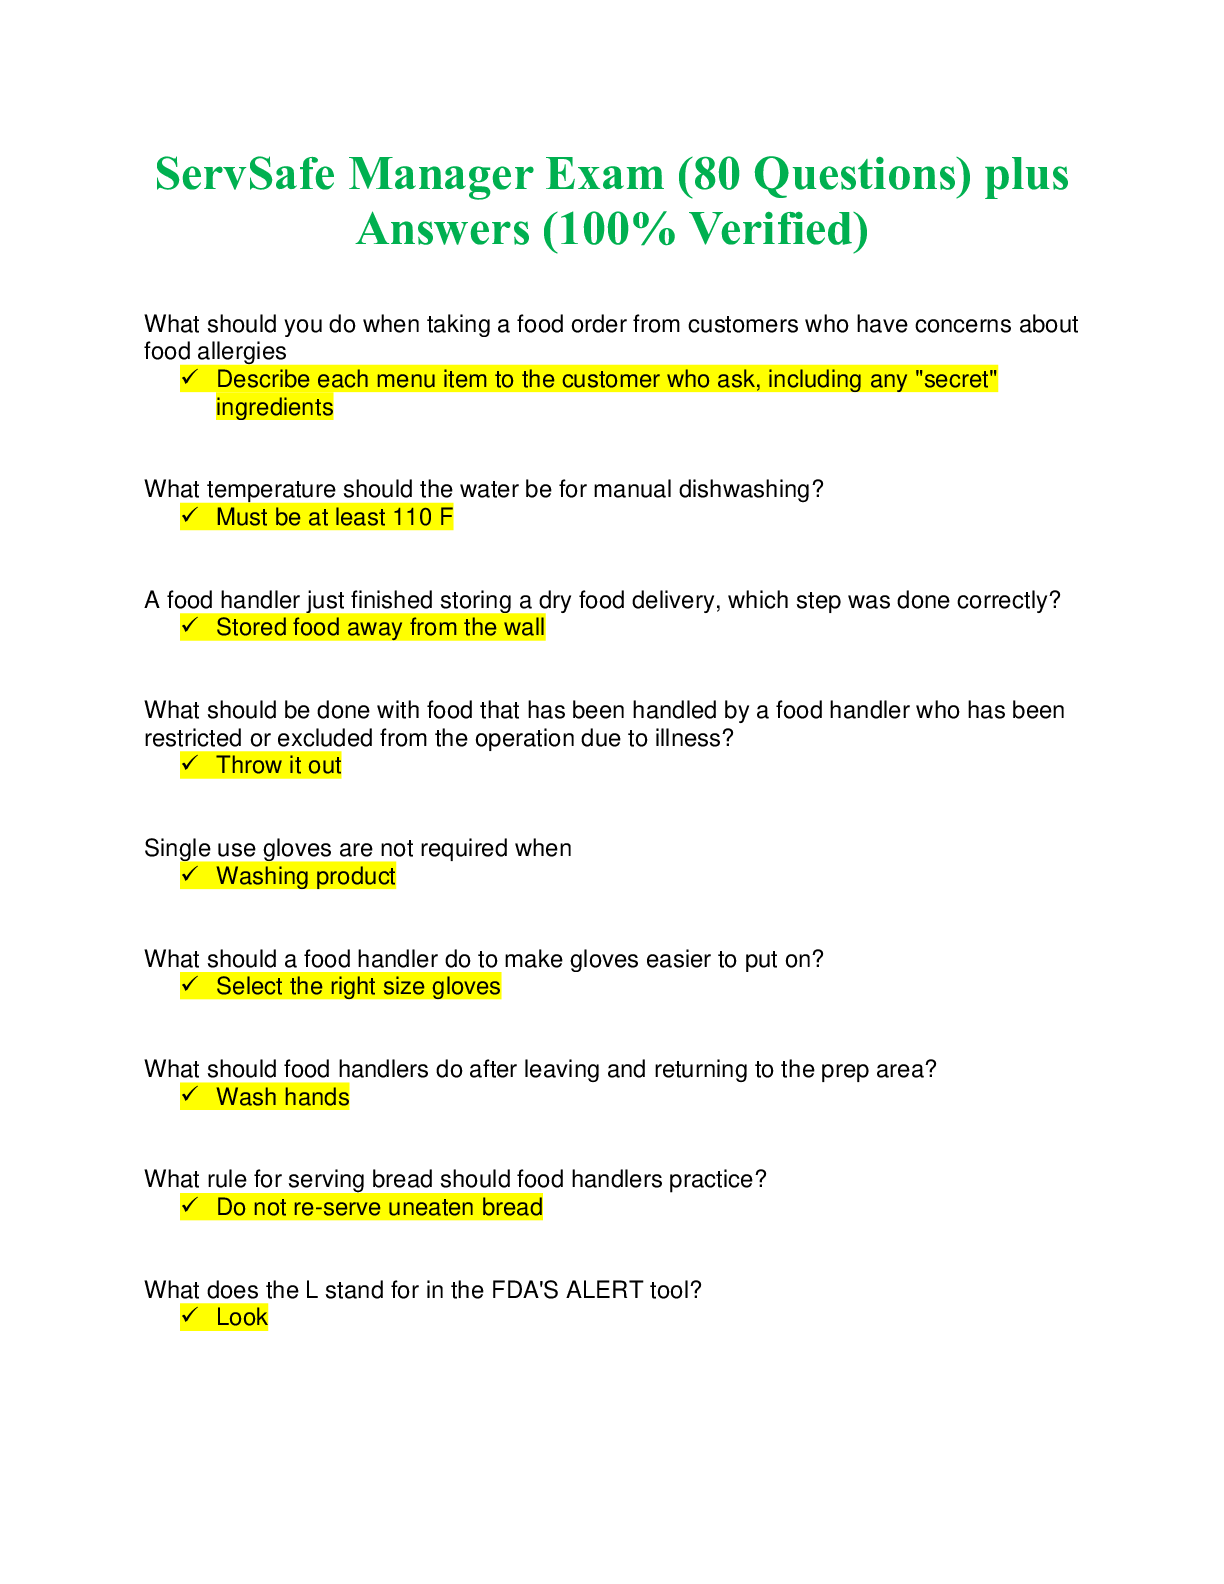
ServSafe Manager Exam (80 Questions) plus Answers (100% Verified)
$ 10.5

Appian Test Exam With Quizs and Verified Answers Graded A+
$ 7.5

Geology Lab Exam II Questions with Verified Answers/Graded A+
$ 10.5

CompTia A+ 220-1001 Core 1 Certification Practice Exam ALL SOLUTION 100% CORRECT SPRING FALL-2023/24 EDITION
$ 14.5
Solutions Manual for Statistics for The Behavioral Sciences 10th Edition By Frederick Gravetter, Larry Wallnau
$ 30
Prealgebra And Introductory Algebra 6th Edition By Elayne Martin Gay SOLUTIONS MANUAL
$ 29
Pearson Edexcel Level 3 GCE Economics A Advanced PAPER 3: Microeconomics and Macroeconomics
$ 12

OCR A Level Further Mathematics A Y543-01 Mechanics June 2022 QUESTION PAPER
$ 15

Edexcel as level chemistry question paper 1 june 2023 + mark scheme
$ 8
Analysis for Financial Management 13th Edition by Robert Higgins
$ 15
eBook [PDF] Petroleum Reservoir Modeling and Simulation. Geology, Geostatistics, and Performance Reduction 1st Edition By Sanjay Srinivasan, Juliana Y. Leung
$ 30

Questions and Answers > Pennsylvania State University - CMPSC 200 PROJECT_6_ADAMS. Using Matlab With User entered Anonymous functions
$ 4
COMPLETE - Elaborated Test Bank for Data Analytics-A Small Data Approach-Chapman & Hall/CRC Data Science Series 1Ed.by Shuai Huang & Houtao Deng.ALL Chapters1-10(123 pages) included and updated for 2023
$ 20.5
PDF(eBook) Topological and Variational Methods with Applications to Nonlinear Boundary Value Problems ,Dumitru Motreanu , Viorica Venera Motreanu,Nikolaos Papageorgiou,1e
$ 25
Power System Analysis and Design, 6th Edition By Glover, Overbye, Sarma | [ebook][PDF]
$ 24
Full Solution Manual for “Probabilistic Machine Learning: An Introduction”
$ 12.5
Intro STATS, 5th Edition By Richard D. De Veaux | [eBook][PDF]
$ 24

OPS 571 Final Exam 2 with all the revised answers(All the correct answers have been highlighted)
$ 9

Pearson Edexcel GCE In AS Further Mathematics (8FM0) Paper 25 Further Mechanics 1 Mark Scheme (Results) November 2021
$ 7

GCSE (9–1) Mathematics J560/06 Paper 6 (Higher Tier) Practice Paper – Set 3
$ 6.5
eBook Rust Crash Course Build High-Performance, Efficient and Productive Software with the Power of Next-Generation Programming Skills 1st Edition By Abhishek Kumar
$ 29

AI-102 Exam Dumps Designing and Implementing a Microsoft Azure AI Solution | Questions AI-102 PDF Dumps AI-102 VCE Dumps.
$ 9
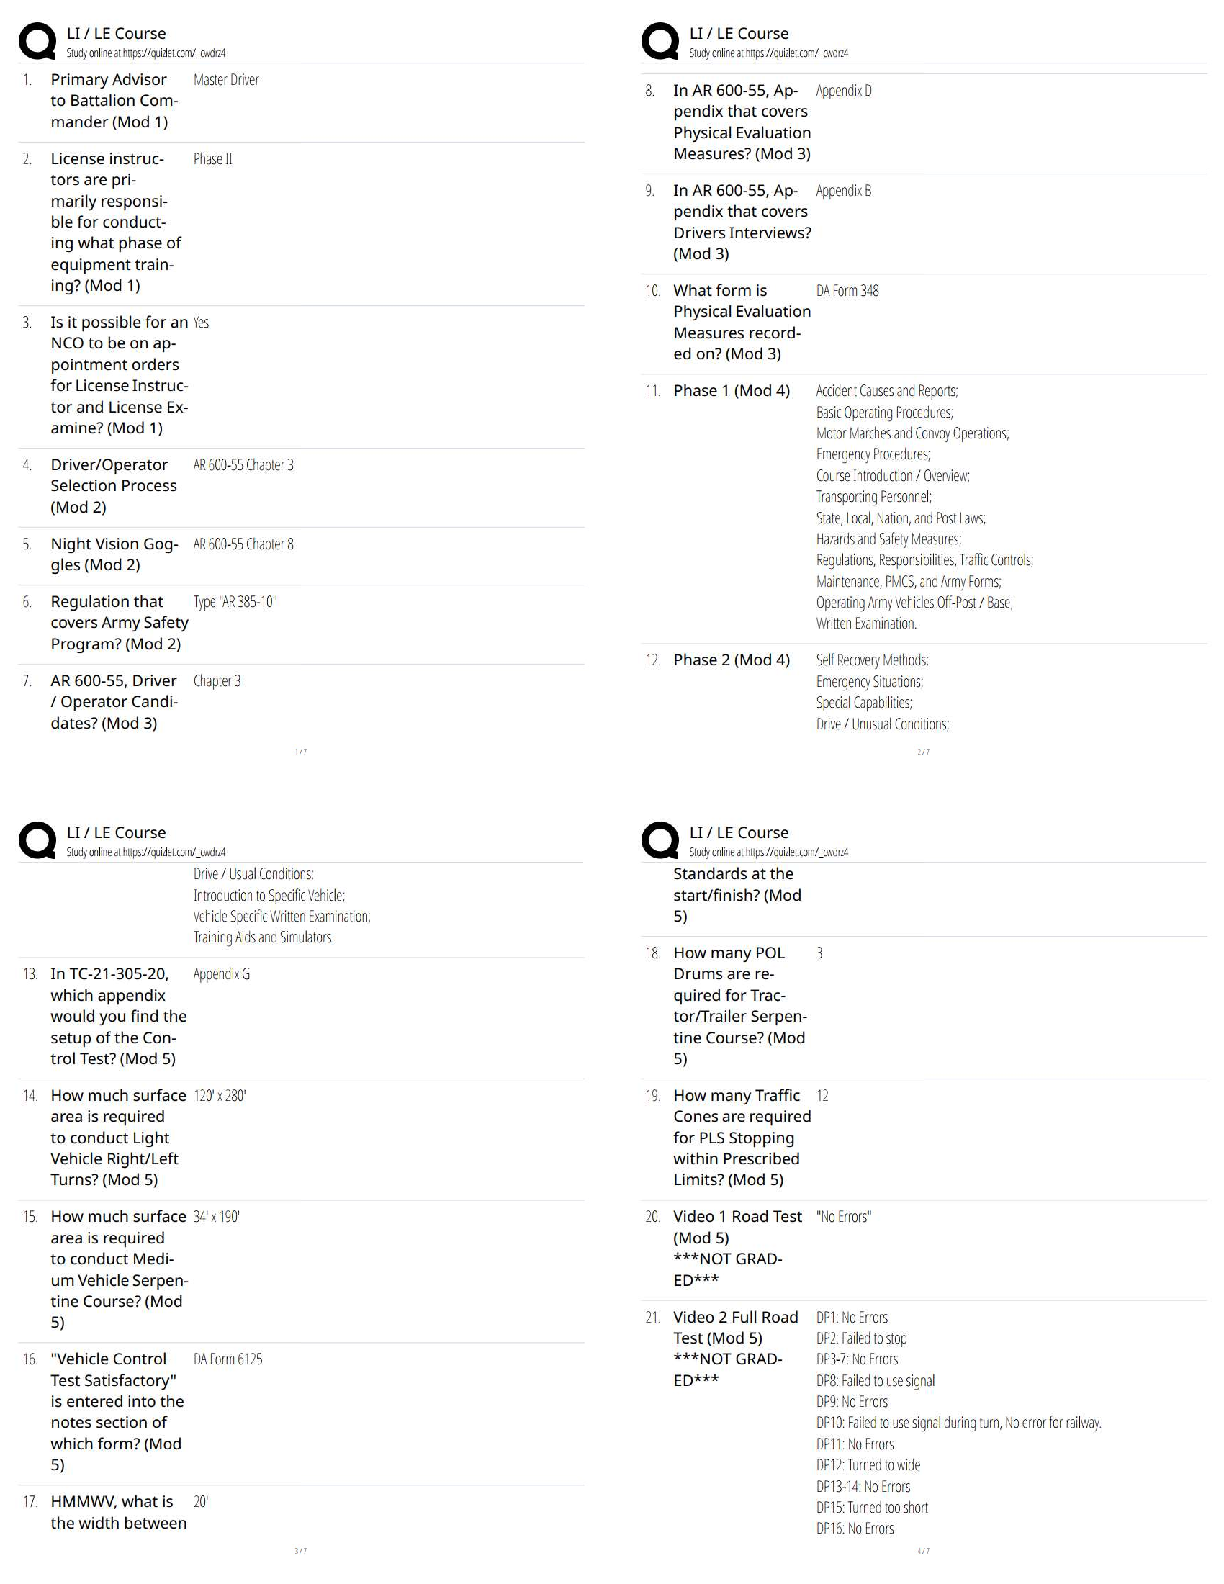
LI/LE 101 – Introduction to Language and Literature / 2025 Update / Score 100% / Study Guide & Exam Prep
$ 8.5

Boat Ed temporary boaters test answers Florida renters temporary test answers
$ 9

Sophia Macro Unit 4 Milestone 4 Questions and Answers with Verified Solutions
$ 10

Pearson Edexcel Mark Scheme (Provisional) Summer 2021 Pearson Edexcel International GCSE In Science (Single Award) (4SS0) Paper 1P
$ 6
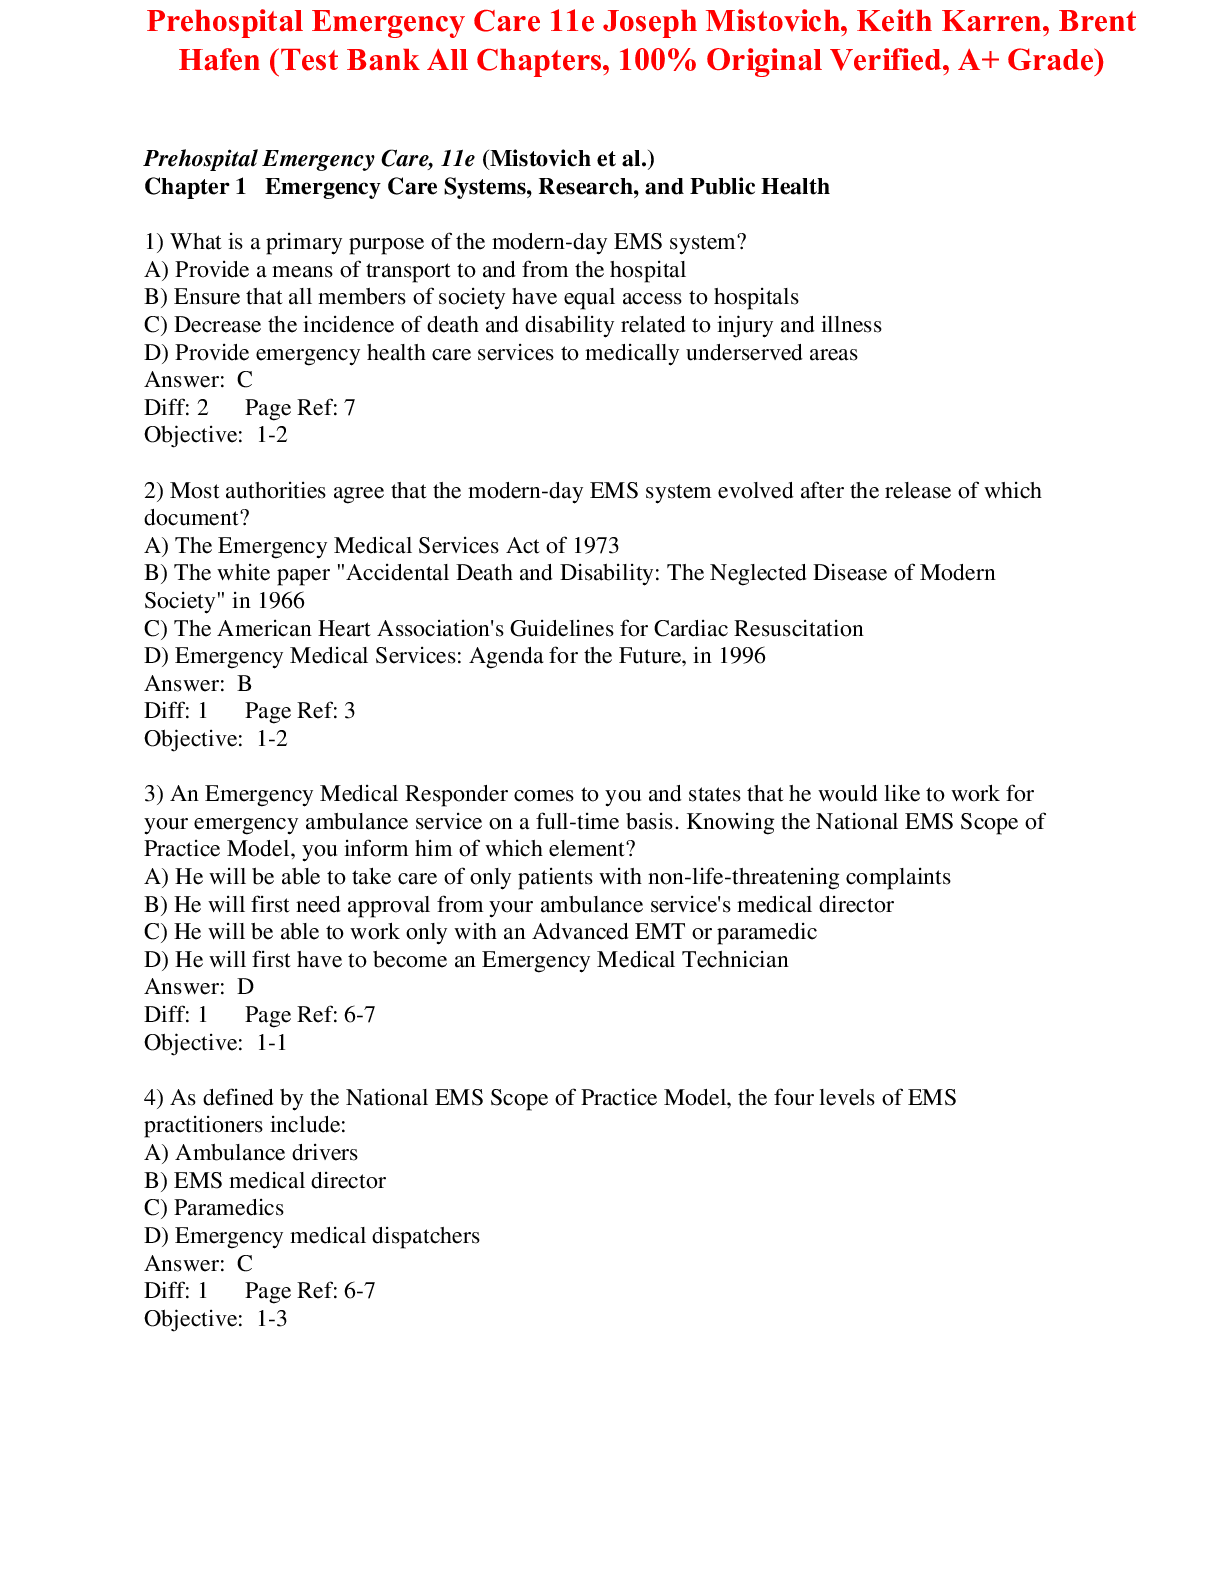
Test Bank For Prehospital Emergency Care 11th Edition By Joseph Mistovich, Keith Karren, Brent Hafen
$ 22

M2L2_ Gizmo Lab #2_ Earthquake Determination of Epicenter - Honors.
$ 7
The Mathematical Association of Victoria Trial Examination 2020 FURTHER MATHEMATICS Written Examination 2
$ 5
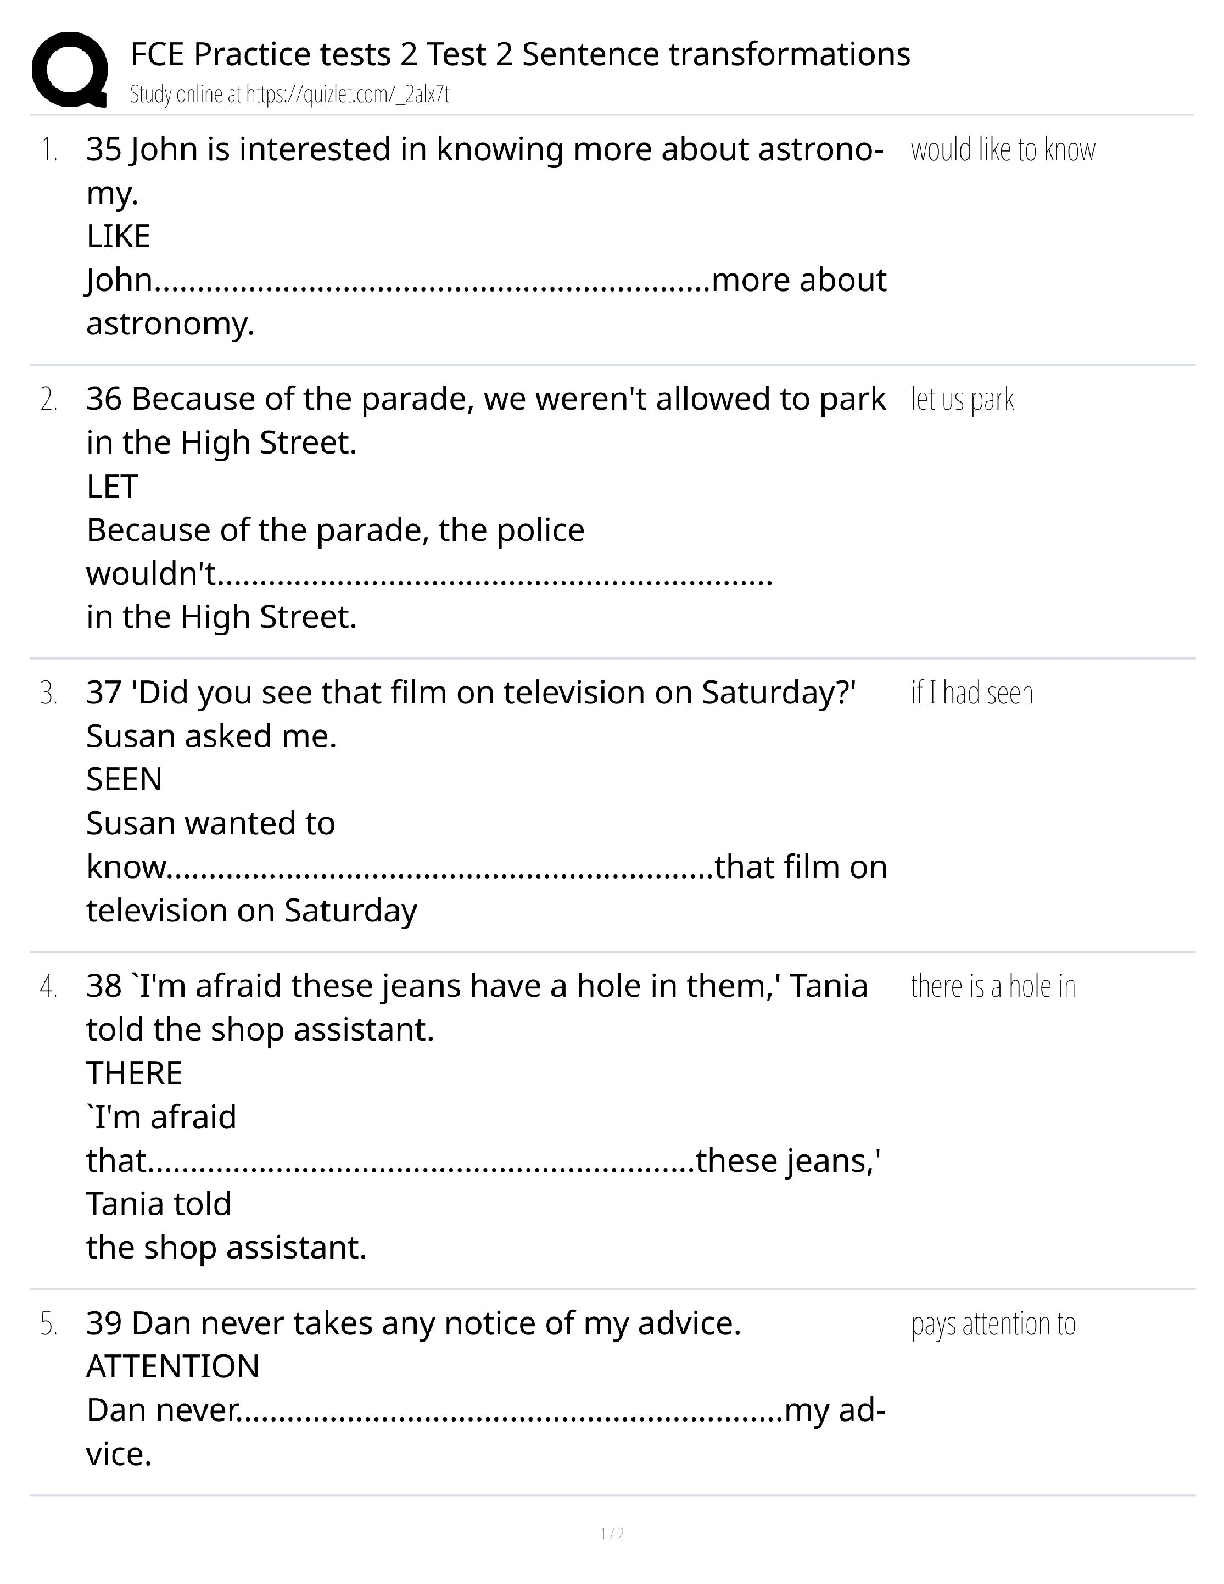
FCE Practice Test 2 Sentence Transformations / Cambridge B2 First / 2025 Update / Score 100%
$ 23.5
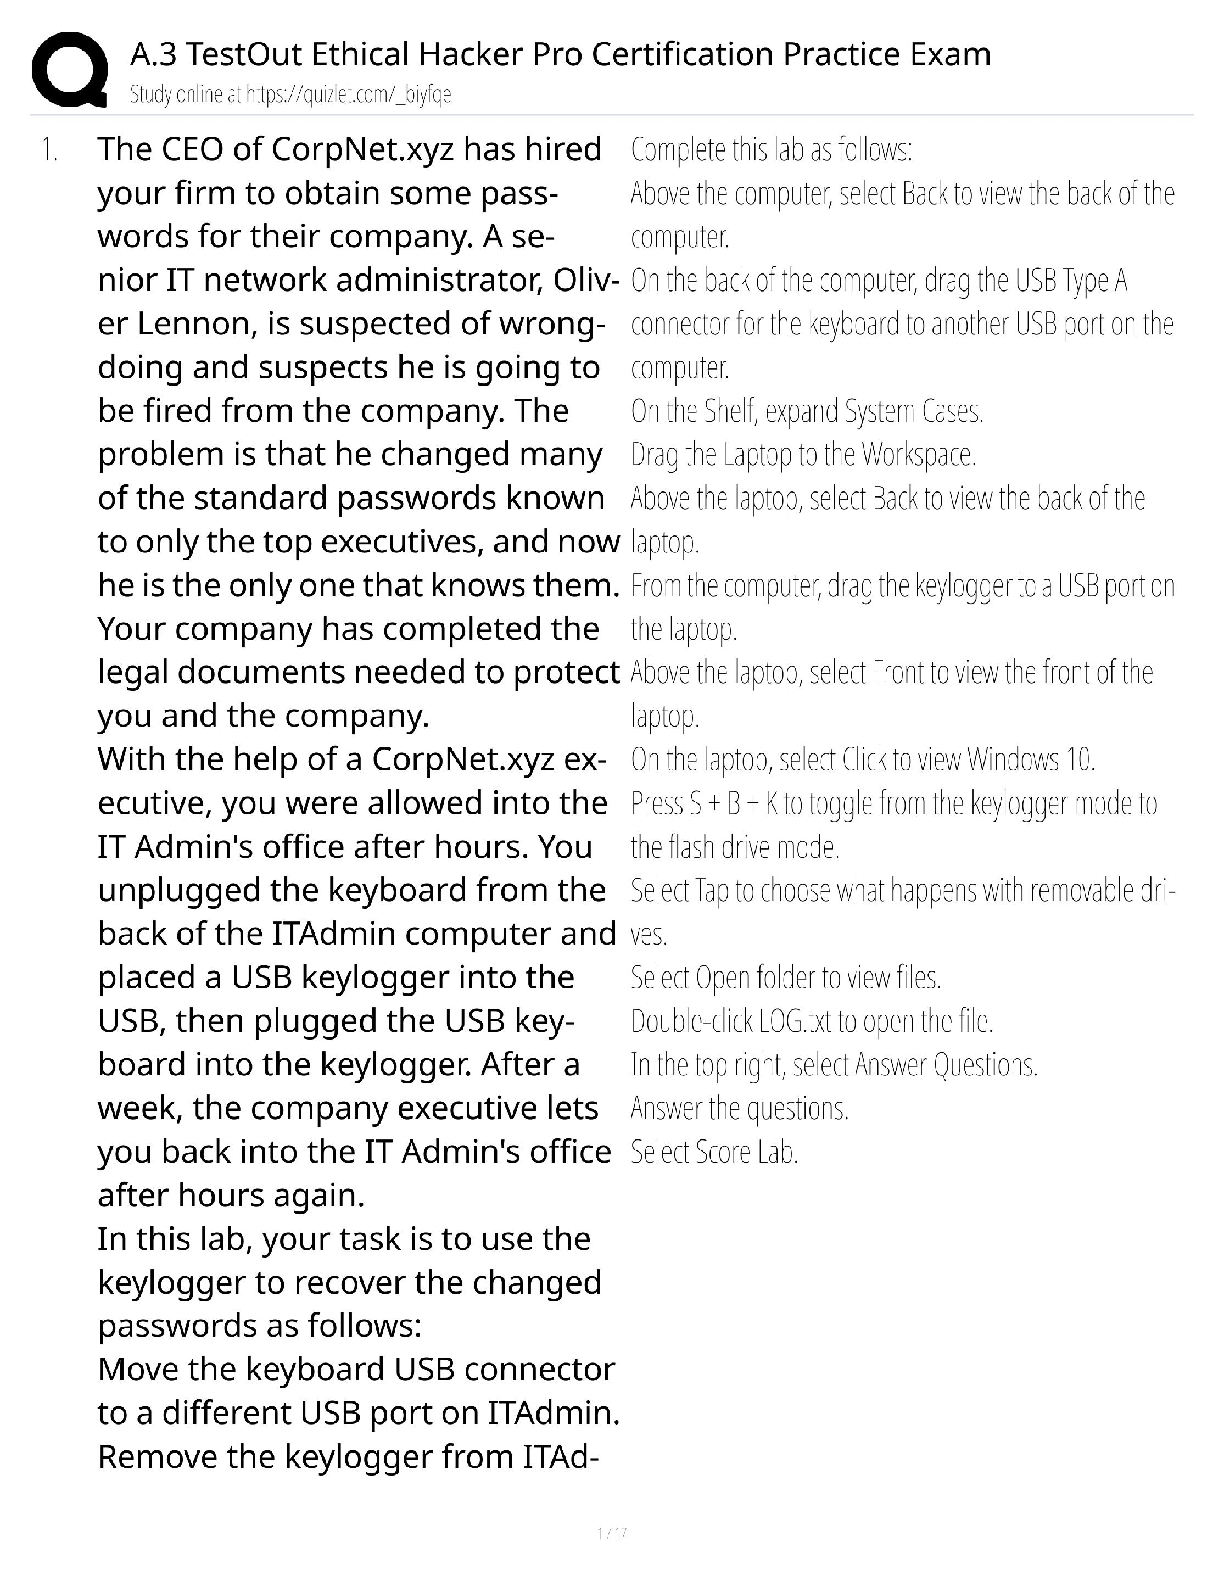
TestOut Ethical Hacker Pro Certification / Practice Exam A.3 Guide / 2025 Update / Score 100%
$ 21.5
Test Bank for Applied Statistics in Business and Economics 2024 By David Doane | All Chapters 100% Original Verified, A+ Grade
$ 29
eBook [PDF] Adapting Television and Literature 1st Edition By Paul Sheehan and Blythe Worthy
$ 29
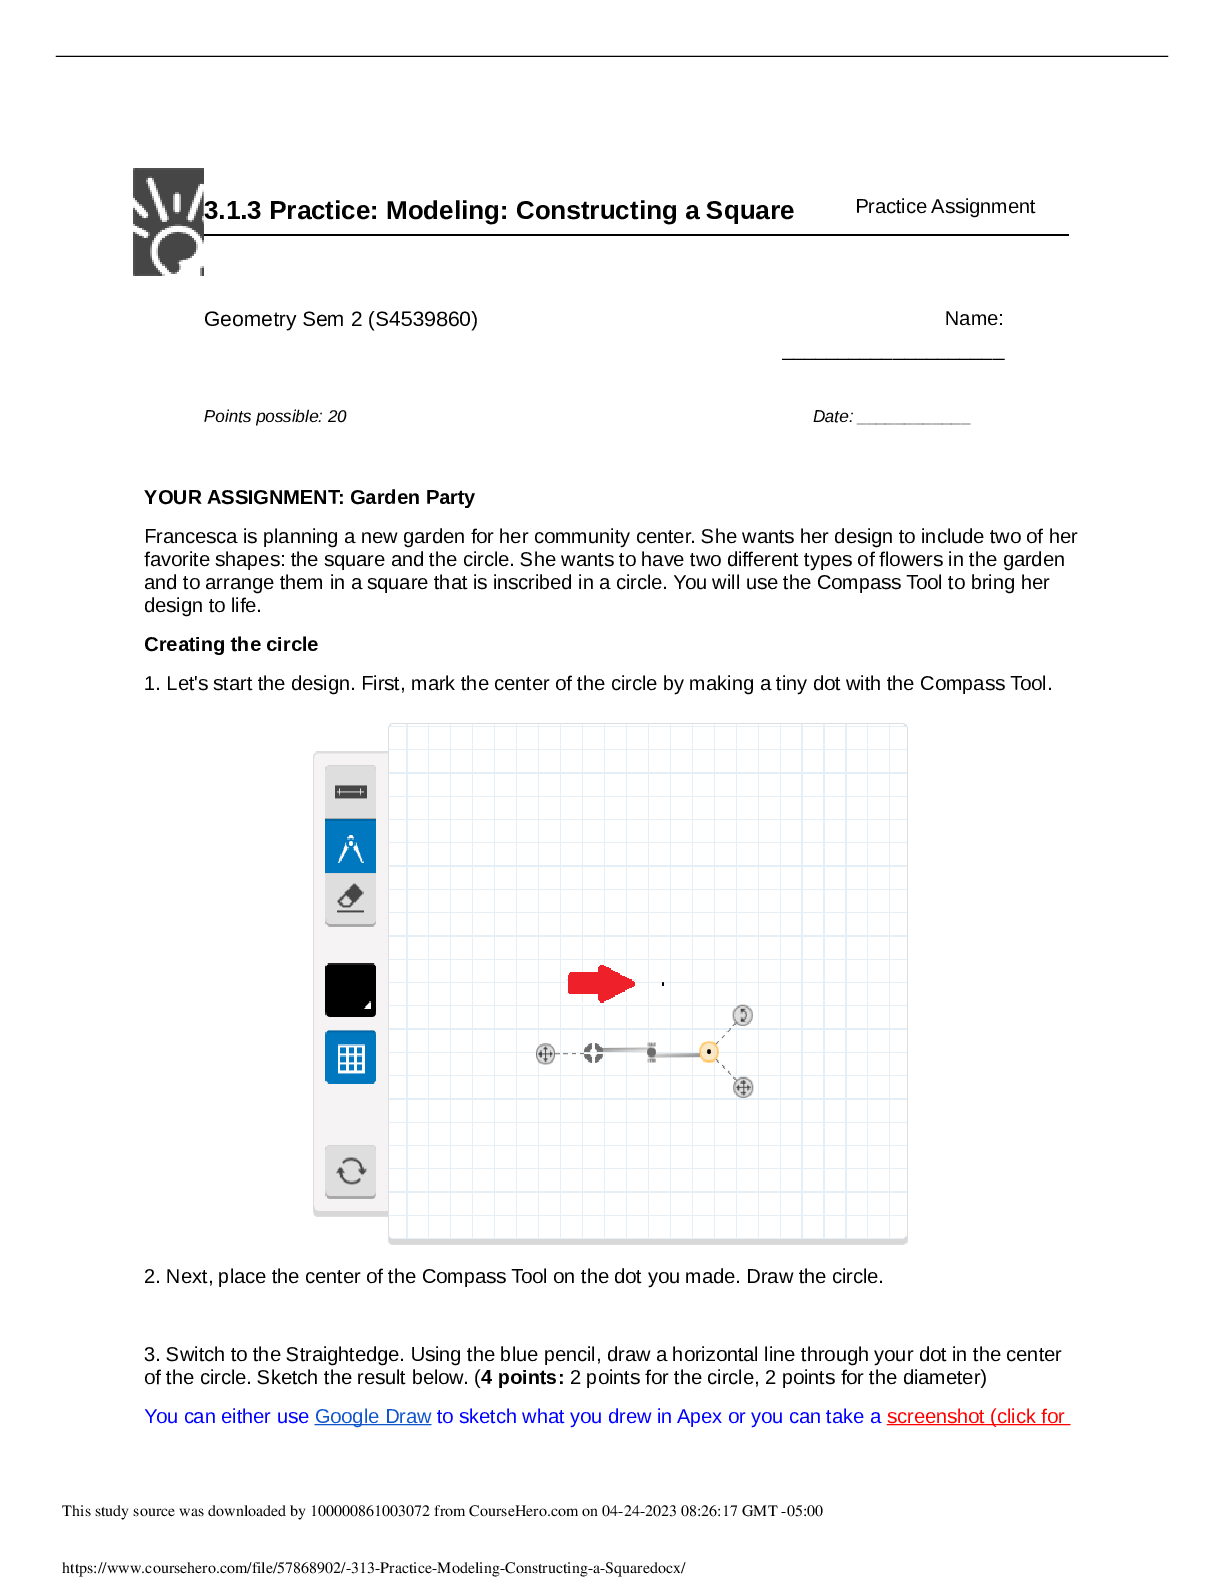
MATH Geometry _ 3.1.3 Practice: Modeling: Constructing a Square Practice Assignment Geometry Sem 2.
$ 10
.png)
A+ ACT Math Practice Test 1 (60 Question Full Test and Review Question Solution)
$ 24

Pearson Edexcel GCE In Mathematics (9MA0) Paper 02 Pure Mathematics 2 Mark Scheme (Results) November 2021
$ 7

MATH 221 Week 1 Discussion: Descriptive Statistics |With A Grade Rated Complete Solutions
$ 6
TEST BANK FOR Advanced Assessment Interpreting Findings and Formulating Differential Diagnoses 5th Edition Goolsby Chapters 1 - 22
$ 15

SC-900 Microsoft Security, Compliance, and Identity Fundamentals EXAM GUIDE
$ 10

Sophia Macroeconomics Final Milestone (5) -Complete Questions and Answers | GRADED A+
$ 11

AutoCAD Quiz Latest Update
$ 5.5

PN I Final Exam Review | Rated A Guide | Latest 2021 / 2022 | Rasmussen College
$ 16.5

Pearson Edexcel GCE In Further Mathematics Paper 01 Core Pure Mathematics 1 Examiners’ Report Principal Examiner Feedback November 2021
$ 5.5
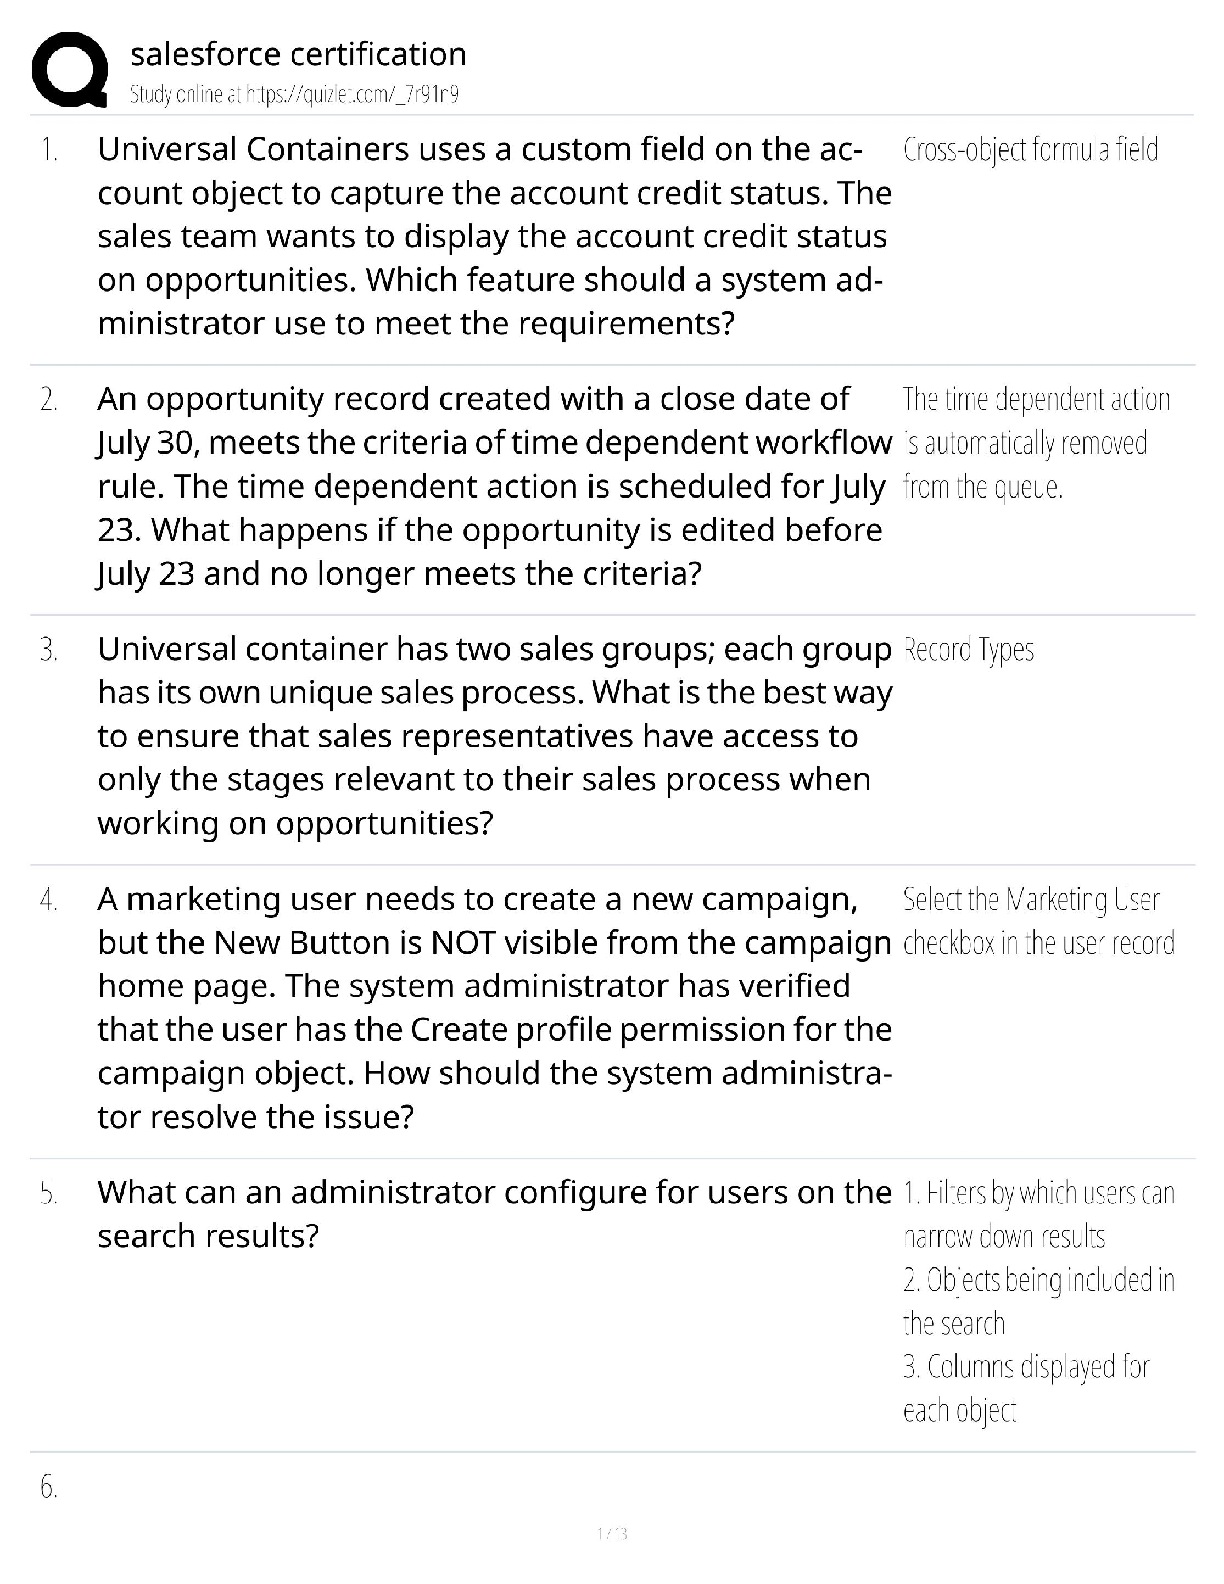
Salesforce Certification / 2024 Exam Guide / Admin, Developer & Cloud Tests / Pass Guaranteed
$ 14
eBook [PDF] The Cambridge Handbook of Private Law and Artificial Intelligence 1st Edition | ISBN: 9781108845595, 1108845592 and eText ISBN: 9781108845595, 1108845592 | by Ernest Lim and Phillip Morgan | Published by Cambridge University Press in 2024
$ 29.5

EARTH AND SPACE SCIENCE SES4U>Earthquakes2EpicenterSE
$ 5
 complete solutions - Chamberlain.png)
MATH 225N Week 7 Assignment- Developing Hypothesis and understanding Possible Conclusion for Proportions (2022-2023) complete solutions - Chamberlain.
$ 15

AORN Periop 101 Final Exam Solved And Graded A+ Q&A in 58 Pages.
$ 11
eBook [PDF] Explainable Artificial Intelligence for Autonomous Vehicles 1st Edition By Kamal Malik, Moolchand Sharma, Suman Deswal
$ 20
A-level DESIGN AND TECHNOLOGY: PRODUCT DESIGN 7552/1 Paper 1 Technical Principles Mark scheme June 2022 Version: 1.0 Final
$ 8

HESI Math Questions, HESI A&P Questions, HESI Reading Questions, Hesi Vocabulary, HESI A2; Math practice test, BEST hesi a2 version 1 and 2,
$ 8

MHF 4U Advanced Functions: UNIT ASSIGNMENT TRIGONOMETRY. Complete Q&A.
$ 10
Test Bank for Legal Ethics 4th Edition By Kent Kauffman, Erin Rybicki (All Chapters, 100% Original Verified, A+ Grade)
$ 17
HESI A2 Math (2022/2023) Already Graded A
$ 9.5
EMTS FINALS REVIEW #1QUESTIONS WITH CORRECT ANSWERS 2024
$ 19
.png)
WGU C779 Web Development Foundations Questions and Answers Graded A+
$ 8

OCR A Level Further Mathematics A Y542-01 Statistics June 2022 Question Paper
$ 12
[eBook][PDF] Statistics for Economics Accounting and Business Studies,7th Edition By Michael Barrow
$ 35

Boiler Operator State Test with complete solution
$ 8

OCR A Level Mathematics A May-June 2024 Mark Scheme Paper 2 (H240-02)
$ 3.5
.png)
VTNE math practice questions and answers with correct solutions
$ 10

C719 Macroeconomics Pre-Assessment Questions and answers latest 2020
$ 7.5
Idioms Certification / Practice Exam & Study Guide / 2025 Update / Score 100%
$ 17.5

[Ebook][Pdf] Forecasting and Predictive Analytics with Forecast, 7th Edition By Keating
$ 20.5

MATH 121 (O) SEMI-FINALS SUMMARY
$ 7
Test_Bank_For_Finite_Mathematics_for_Business_Economics_Life_Sciences
$ 15
Test Bank For Computer Organization and Architecture 11th Edition By William Stallings (All Chapters, 100% Original Verified, A+ Grade)
$ 25
eBook (EPUB) Transitions in Jungian Analysis 1st Edition By Pamela J. Power
$ 16
Advanced Engineering Mathematics, SI Edition 8th Editionby Peter O'Neil SOLUTIONS MANUAL