Statistics > SOPHIA Milestone > Sophia Statistics Final Milestone with Rationale (All)
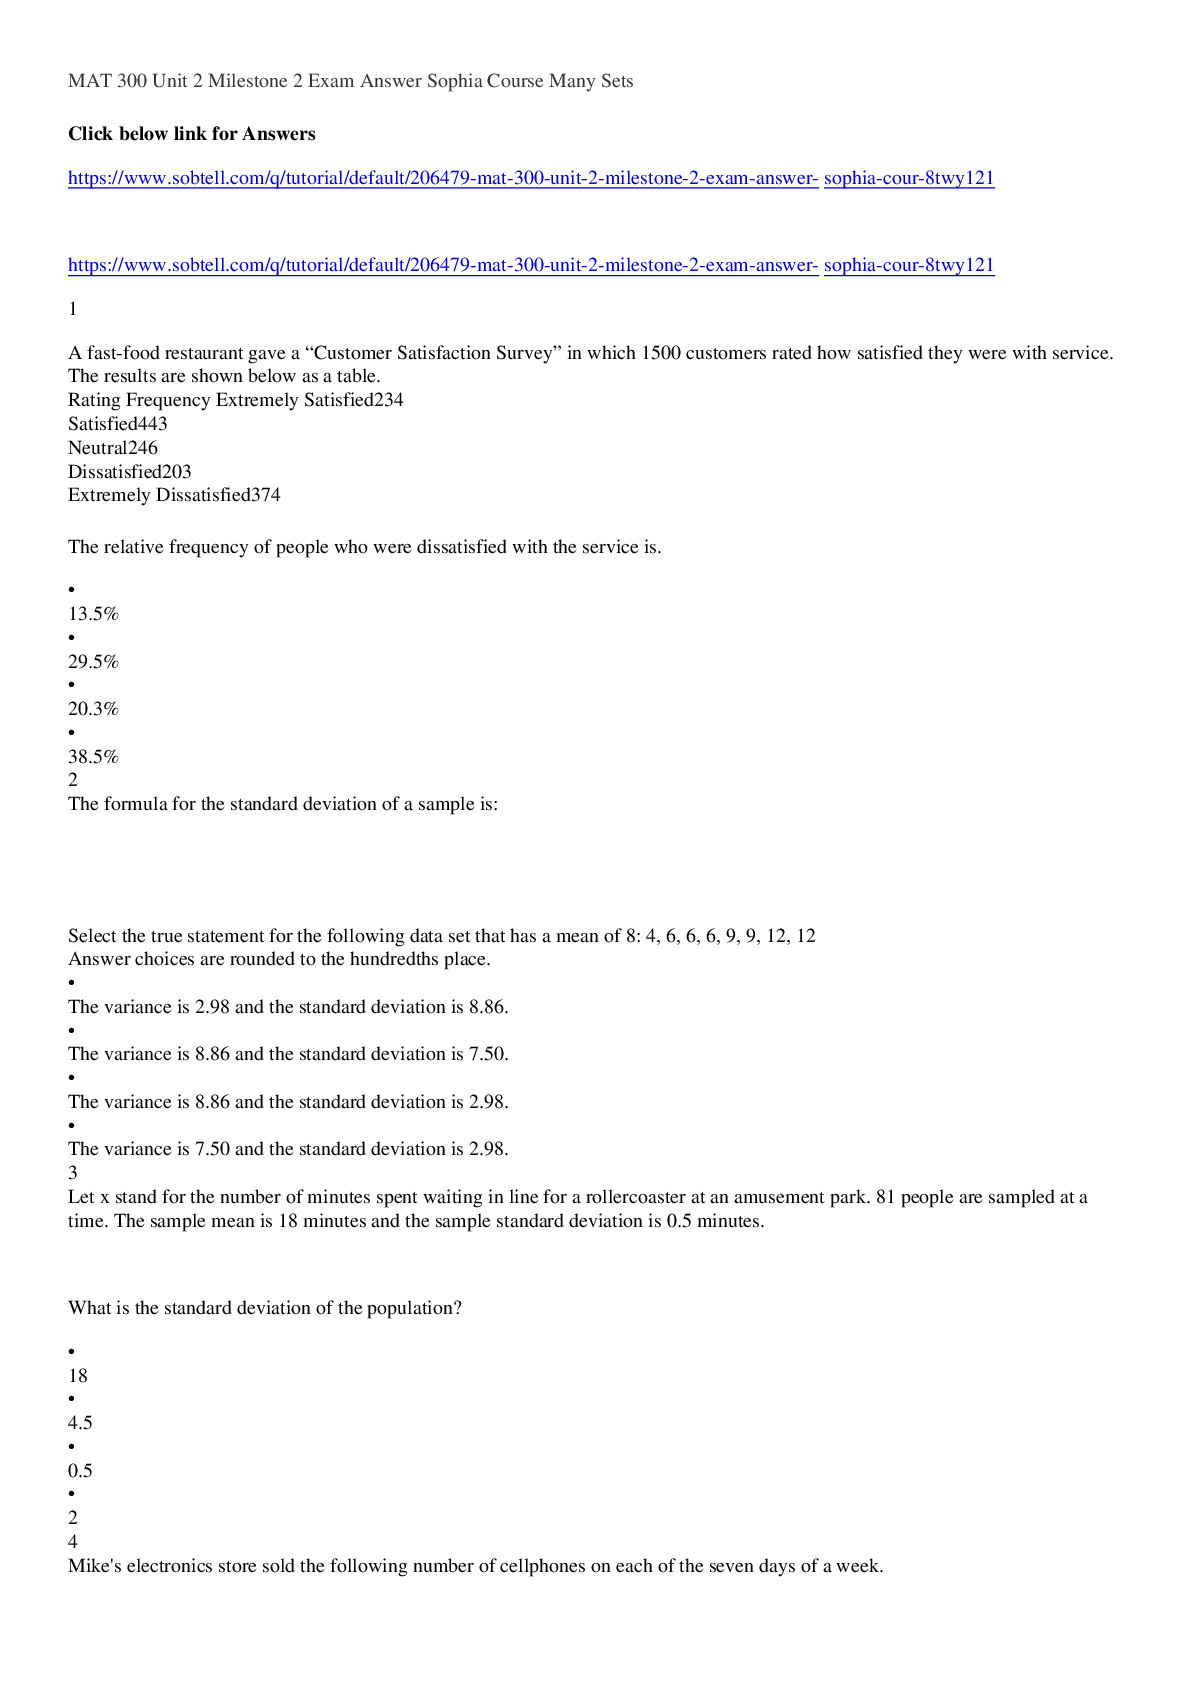
Sophia Statistics Final Milestone with Rationale
Document Content and Description Below
Last updated: 3 months ago
Preview 1 out of 21 pages
Instant download


Buy this Document to get the Full Access Instantly
Provided by Students Who Aced it
We Verify Document Content to Gurantee Accuracy
Reviews( 0 )
Document information
Connected school, study & course
About the document
Uploaded On
Aug 07, 2021
Number of pages
21
Written in
All

Additional information
This document has been written for:
Uploaded
Aug 07, 2021
Downloads
0
Views
115
Document Keyword Tags
Recommended For You
Get more on SOPHIA Milestone »
Sophia Statistics Unit 4 Milestone, questions/Answers/Rational...

SOPHIA Statistics Unit 4 Milestone. Questions/Answers & Ration...
Sophia Statistics FINAL Milestone. With RATIONALE and CONCEPT....
SOPHIA STATISTICS FINAL MILESTONE WITH RATIONALE AND CONCEPT |...
Sophia Statistics Unit 1 Milestone, Revised, answers/ Rational...
Sophia Statistics Milestones 6 Combined Final Study Guides, 20...


SOPHIA Statistics Milestones Test Combined Questions and Answe...

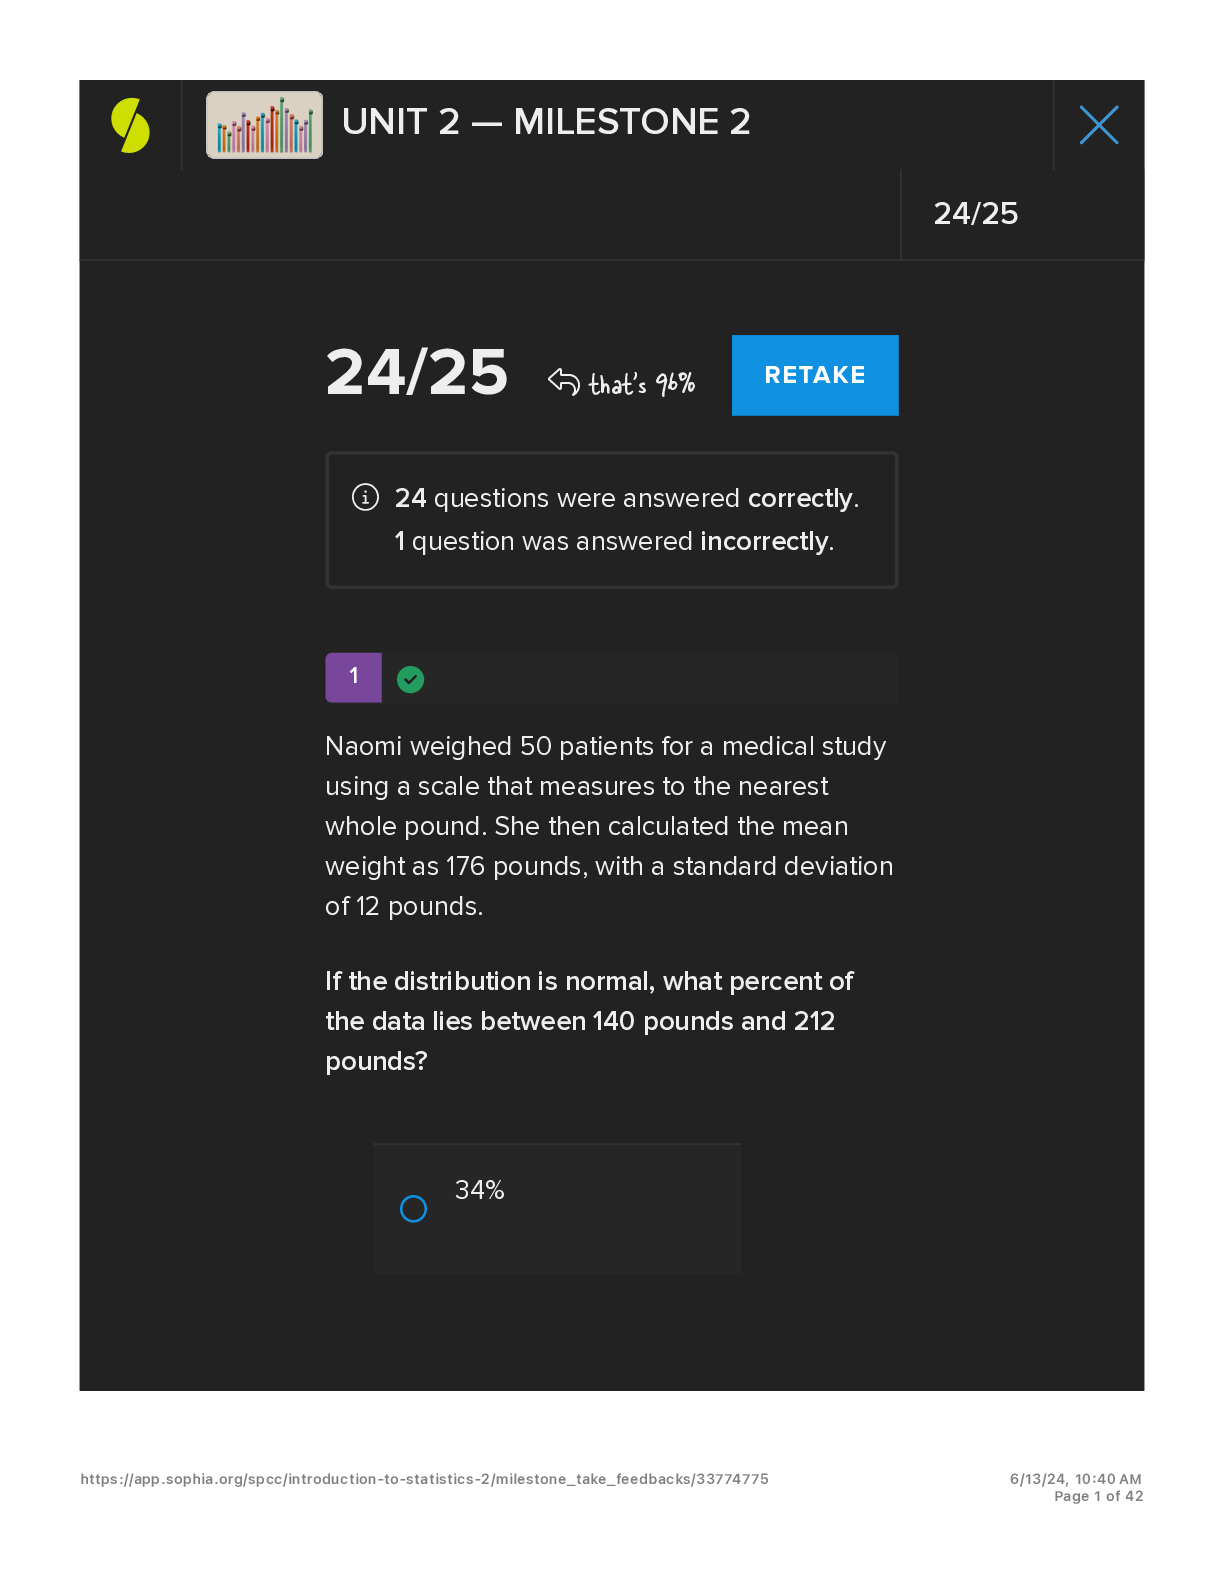
Sophia Learning STAT1001: Introduction to Statistics UNIT 2 —...
Sampling Design and Analysis, 3e by Sharon Lohr (Solutions Man...
.png)
Business Statistics, 4e Norean Sharpe, Richard Veaux, Paul Vel...
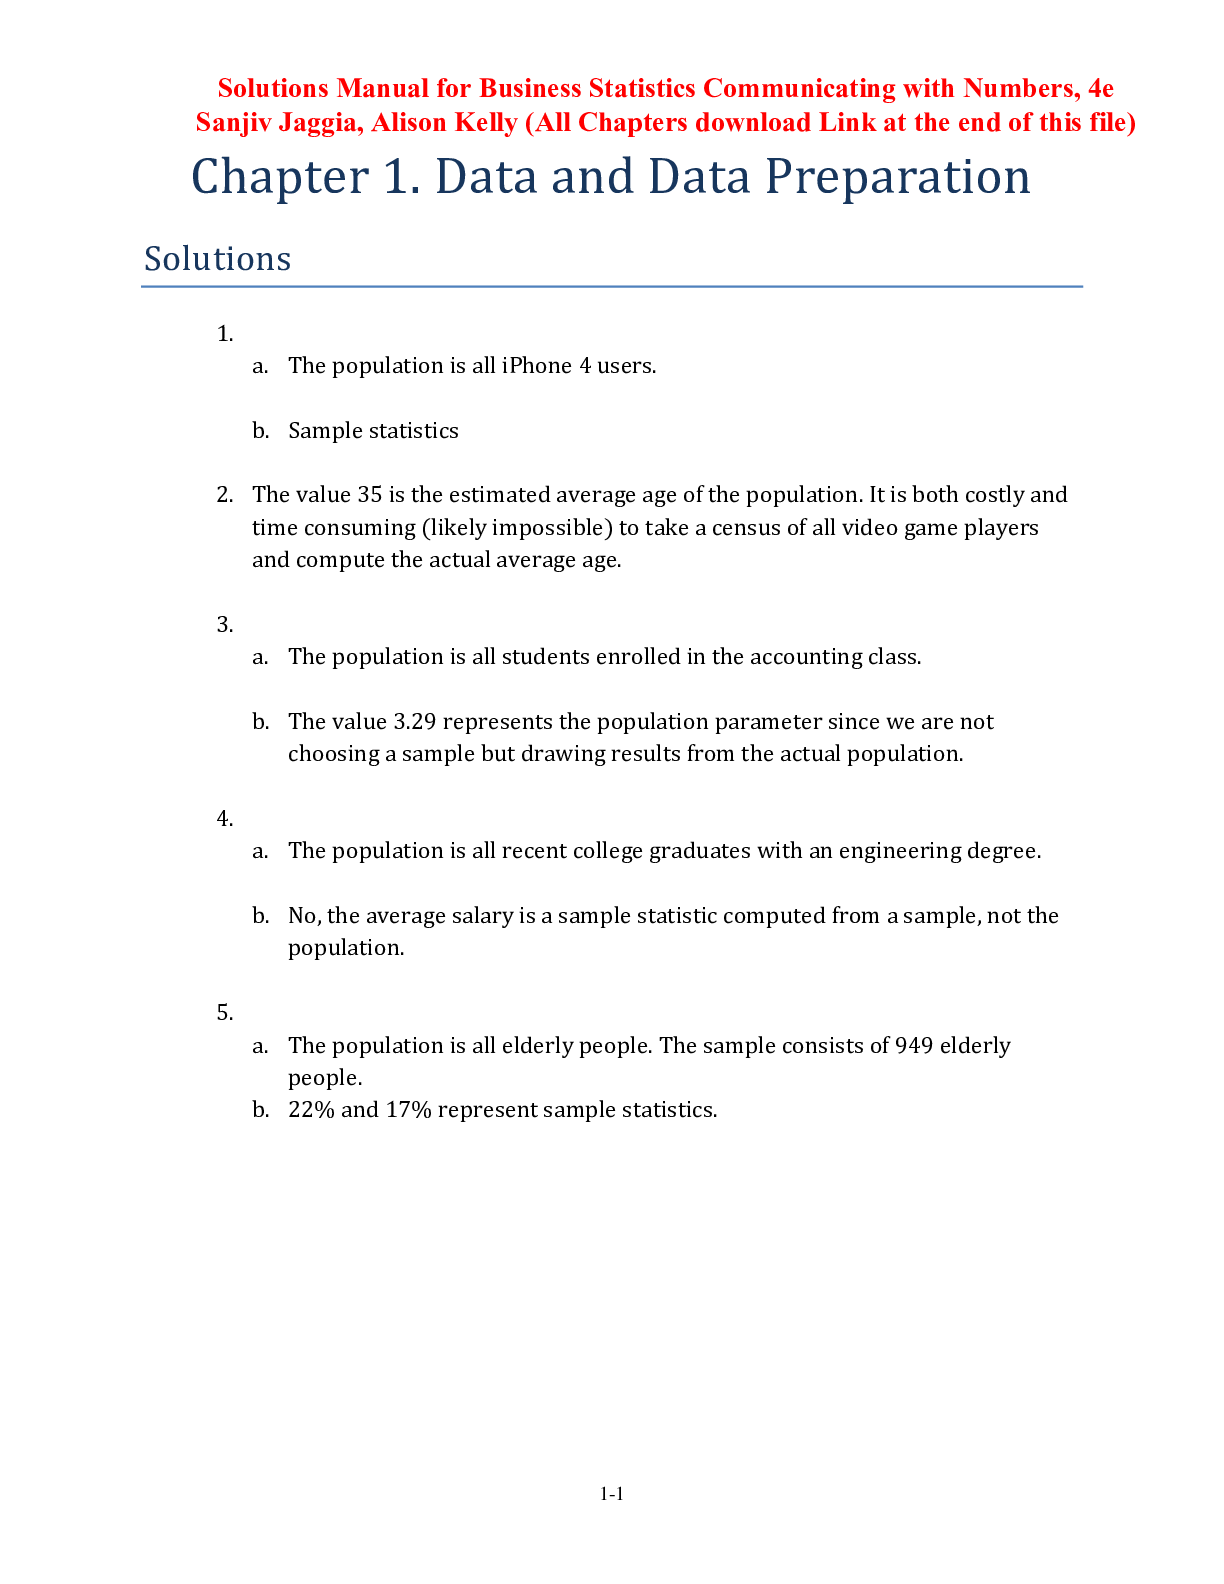
Solutions Manual for Business Statistics Communicating with Nu...