Research Paper > The-Normal-Distribution-Estimation-Correlation-1
The-Normal-Distribution-Estimation-Correlation-1
THE NORMAL DISTRIBUTION
DEFINITION: A continuous random variable X is said to be normally distribu
...
Research Paper > The-Normal-Distribution-Estimation-Correlation-1
The-Normal-Distribution-Estimation-Correlation-1
THE NORMAL DISTRIBUTION
DEFINITION: A continuous random variable X is said to be normally distributed if its density
function is given by:
for and for constants µ and σ, where
Notation: If X follows the above distribution, we write
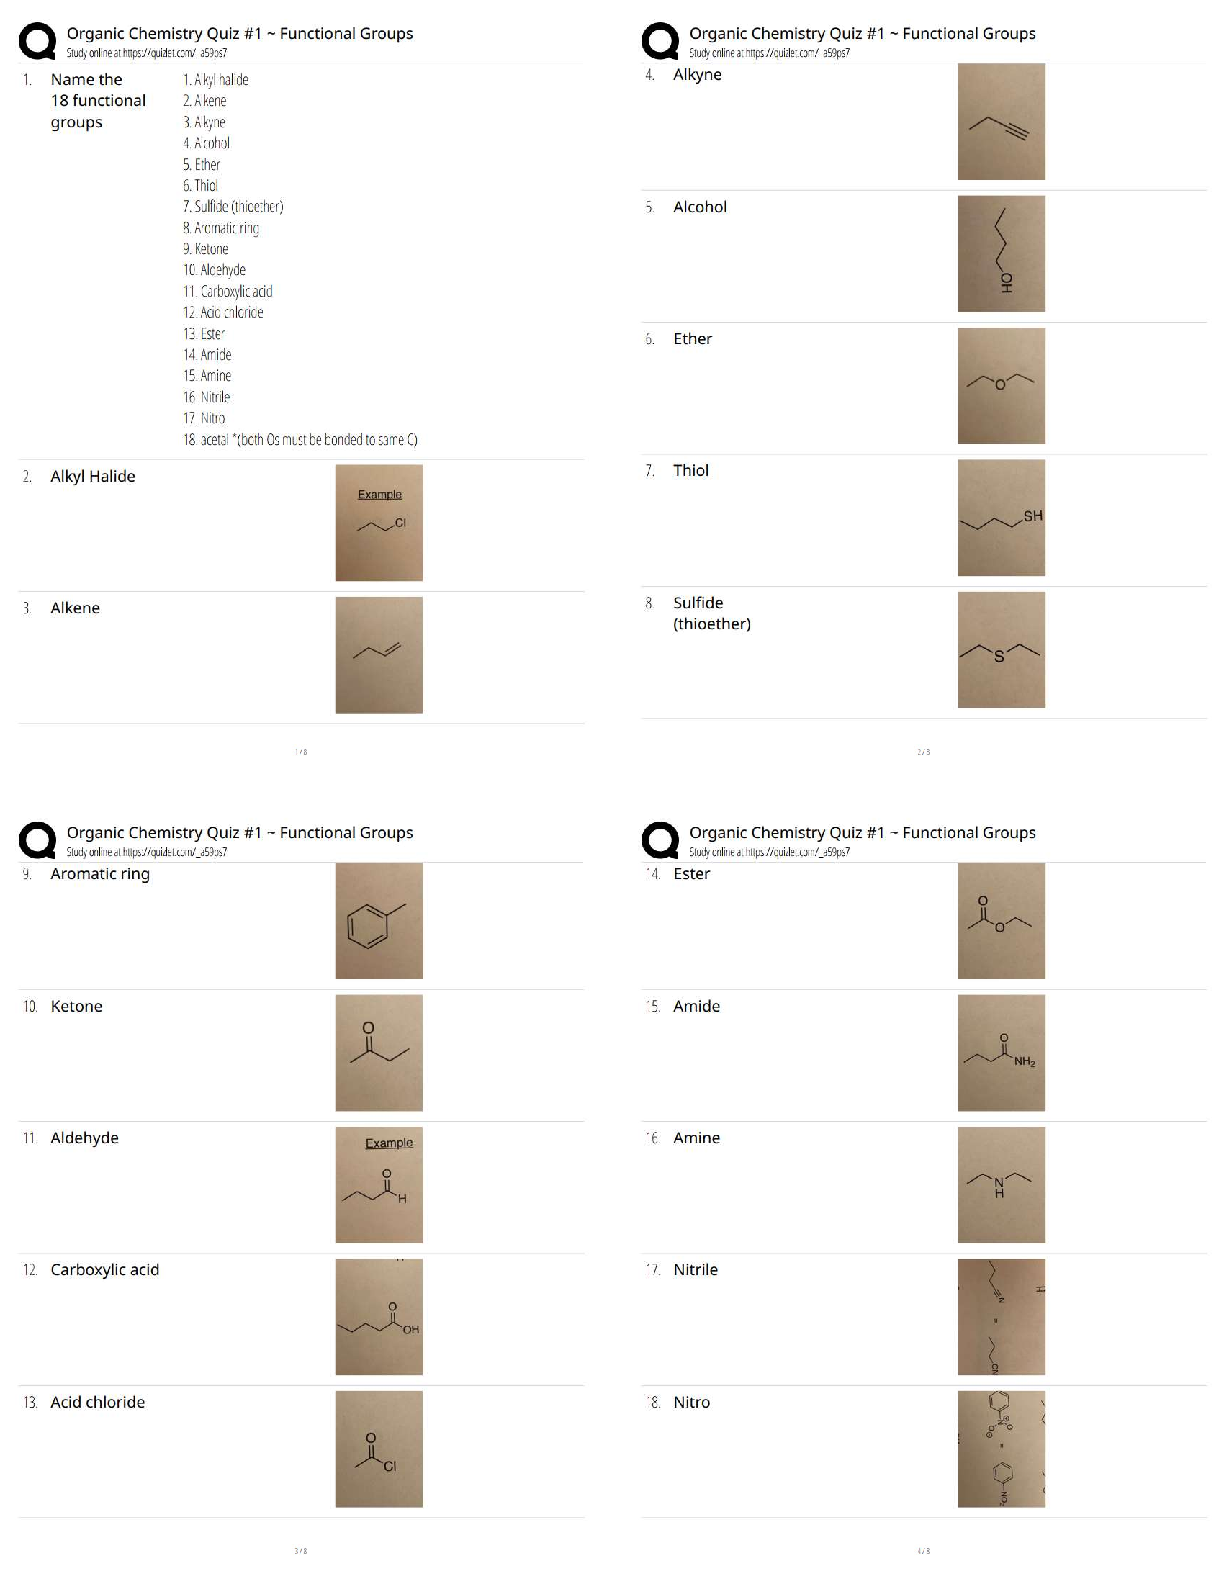
The graph of the normal distribution is called normal curve.
Properties of the normal curve:
1. The curve is bell-shaped and symmetric about a vertical axis through the mean µ.
2. The normal curve approaches the horizontal axis asymptotically as we proceed in either
direction away from the mean.
3. The total area under the curve and above the horizontal axis is equal to 1.
-3 -2 -1 0 1 2 3
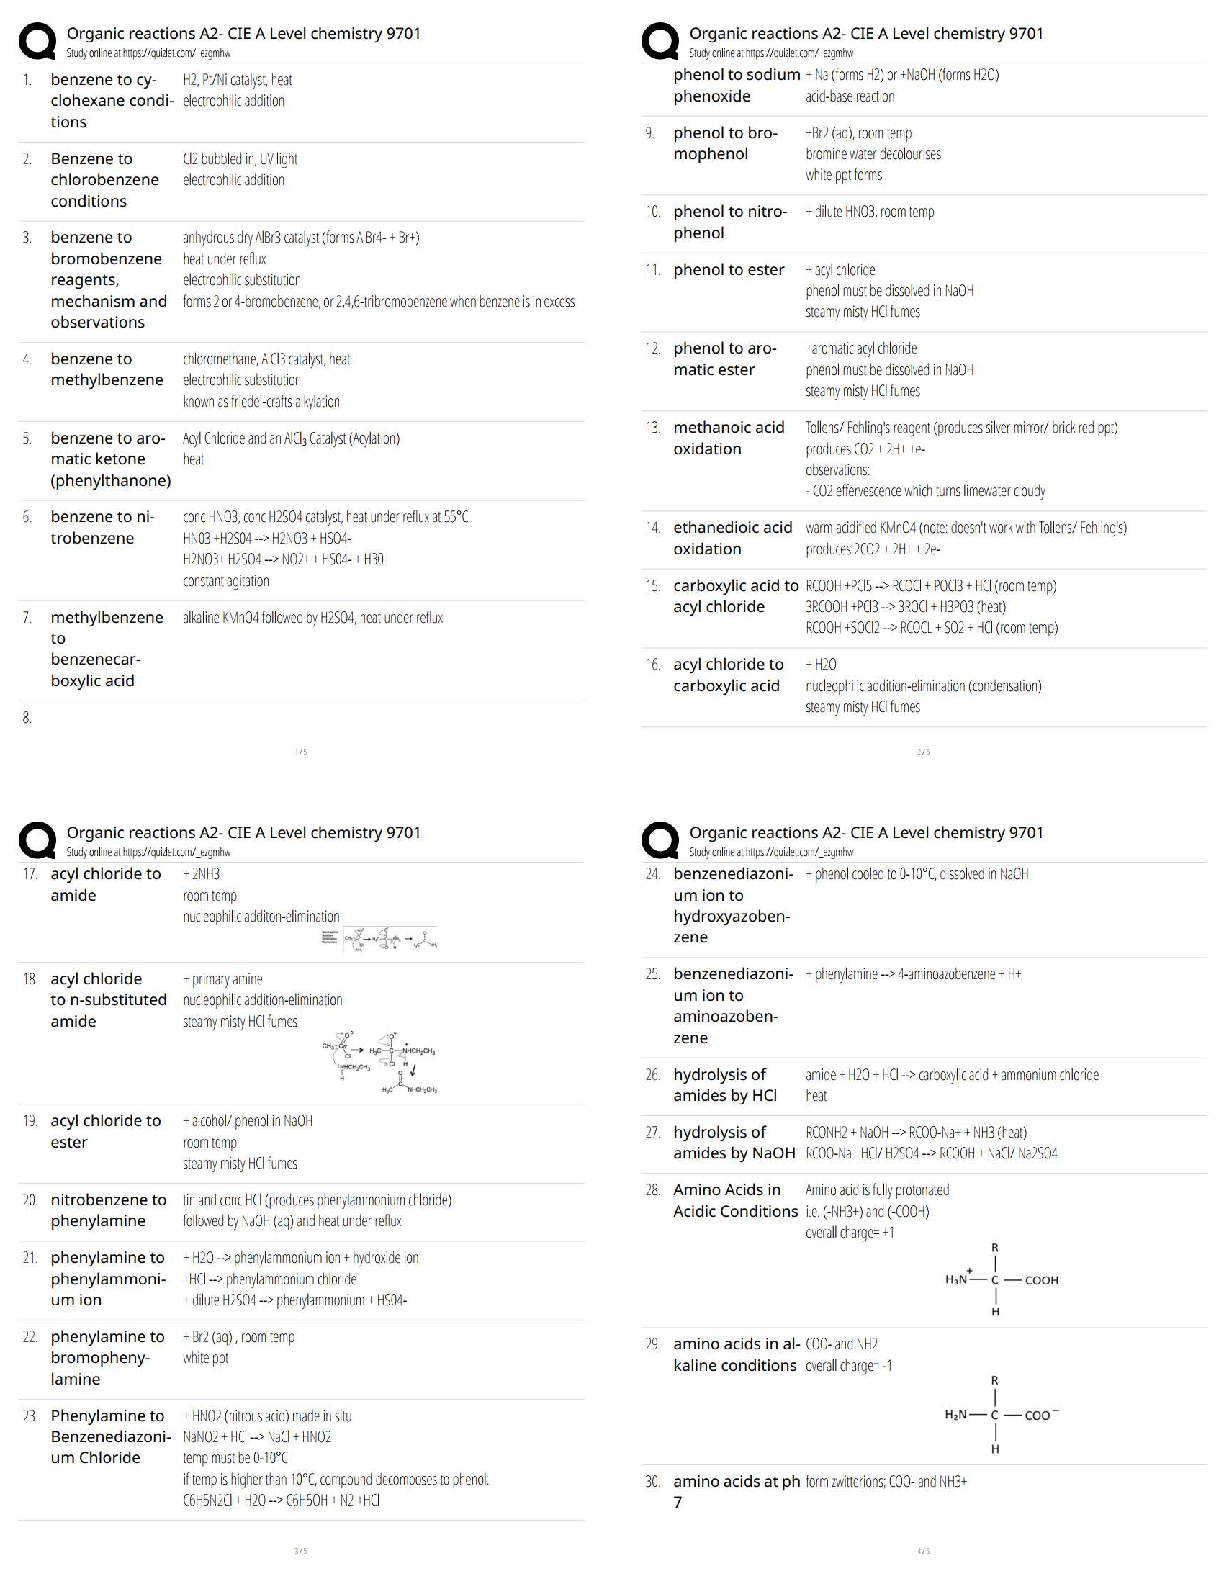
DEFINITION: The distribution of a normal random variable with mean zero and standard
deviation equal to 1is called a standard normal distribution.
If , then X can be transformed into a standard normal random variable
through the following transformation:
If X is between the values , the random variable Z will fall between the
corresponding values:
Therefore,
Examples:
1. Let Z be a standard normal random variable. That is, . Find the following
probabilities: (see the z-table for the probabilities)
A.
B.
C.
D.
2. Let Z be a standard normal random variable. That is . Find the value of a.
A.
B.
C.
3. Let X be a normal random variable with . Find the following
probabilities:
A.
Therefore, the
B.
Therefore, the
C.
Therefore, the
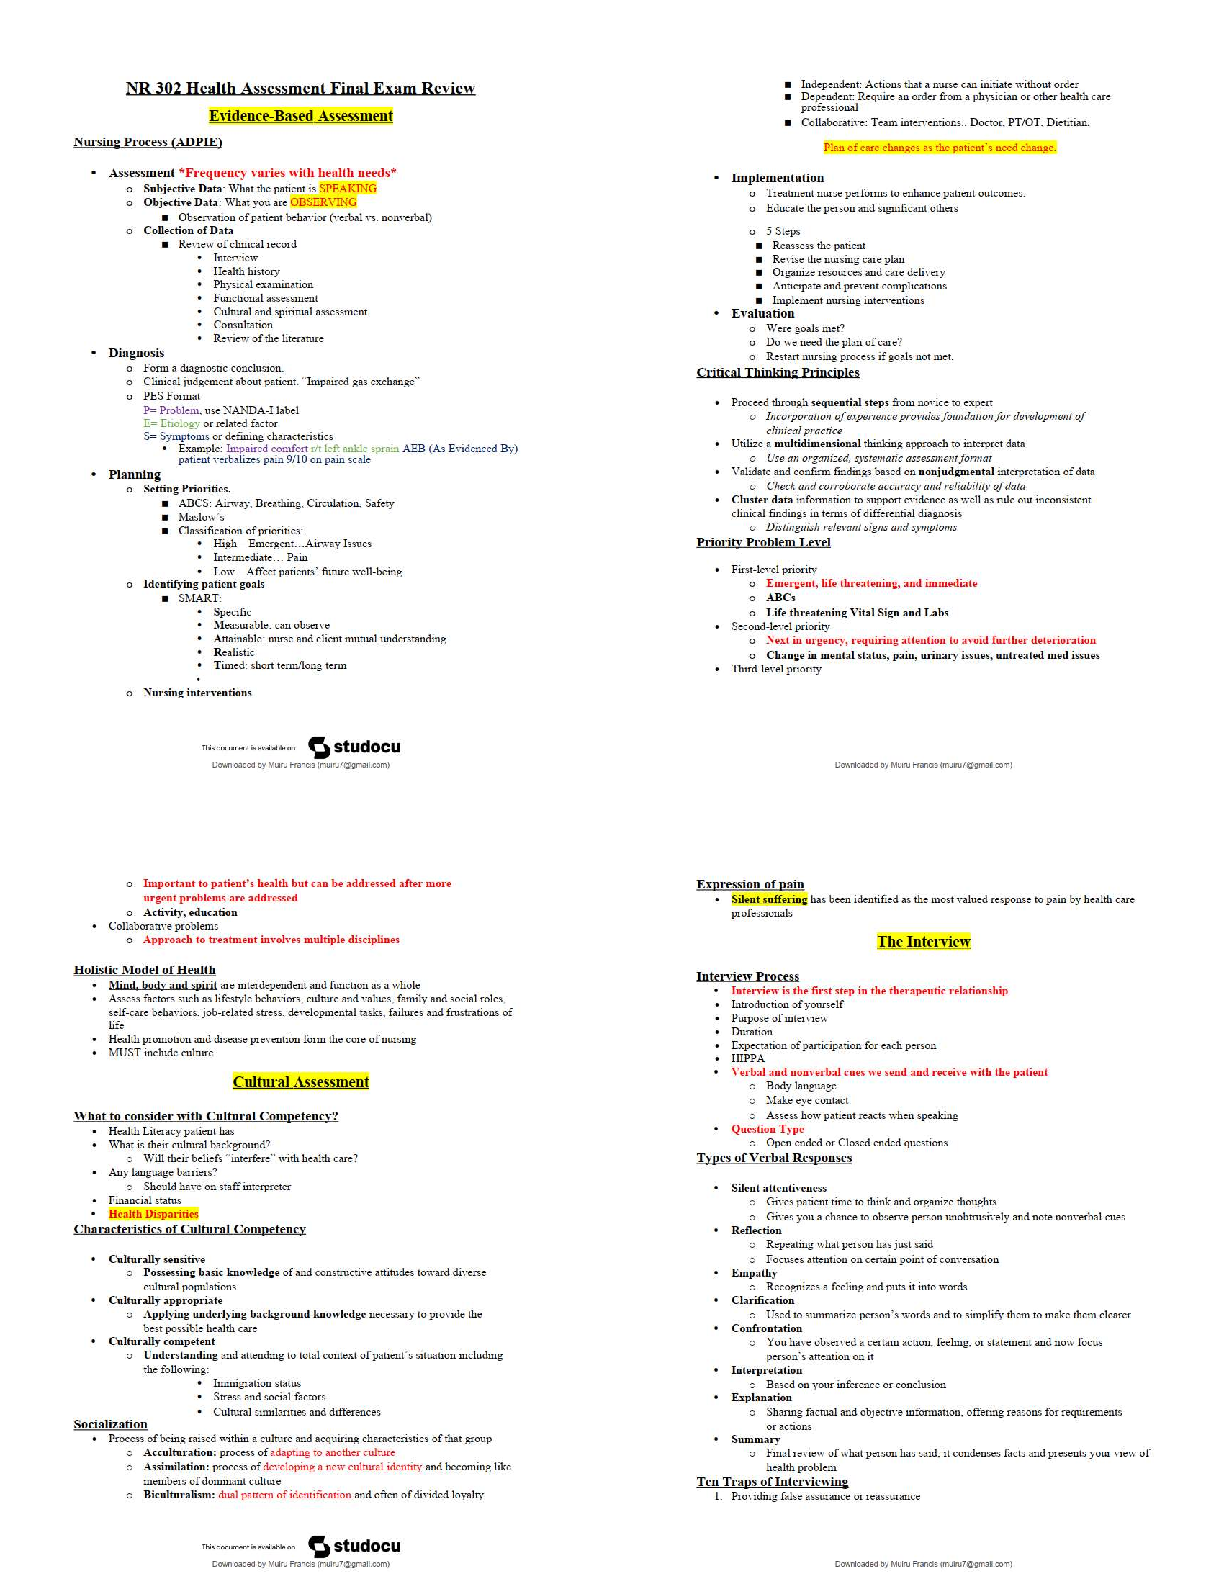
4. Given a test with a mean of 84 and a standard deviation of 12.
A. What is the probability of an individual obtaining a score of 100 or above in this
test?
B. What score includes 50% of all the individuals who took the test?
C. If 654 students took the examination, then how many students got a score below
60?
Solution: Given: µ=84, σ=12
A.
Therefore, the probability of an individual obtaining a score of 100 or above on this test
is 0.0918 or 9.18%.
B. In notation form, the statement is equivalent to:
Finding the corresponding z-score of the probability 0.50, z = 0.00
From the transformation formula,
Therefore, the score that includes 50% of those who took the exam is 84.
C. Given: µ=84, σ=12, N= 654
The number of students who got a score lower than 60 is equal to the product of the
probability and the total number of students.
Exercise 6.2
1. Let Z be a standard normal variable. Find the following probabilities:
a.
b.
c.
d.
2. Given a normal distribution with µ= 82 and find the probability that X assumes
a value
a. Less than 78
b. More than 90
c. Between 75 and 80
3. The mean weight of 500 male students at a certain college is 151 pounds. And the
standard deviation is 15 pounds. Assume that the weights are normally distributed.
a. How many students weigh between 120 and 155 pounds?
b. What is the probability that a randomly selected male student weighs less than 128
pounds?
ESTIMATION
[Show More]


.png)
.png)
.png)