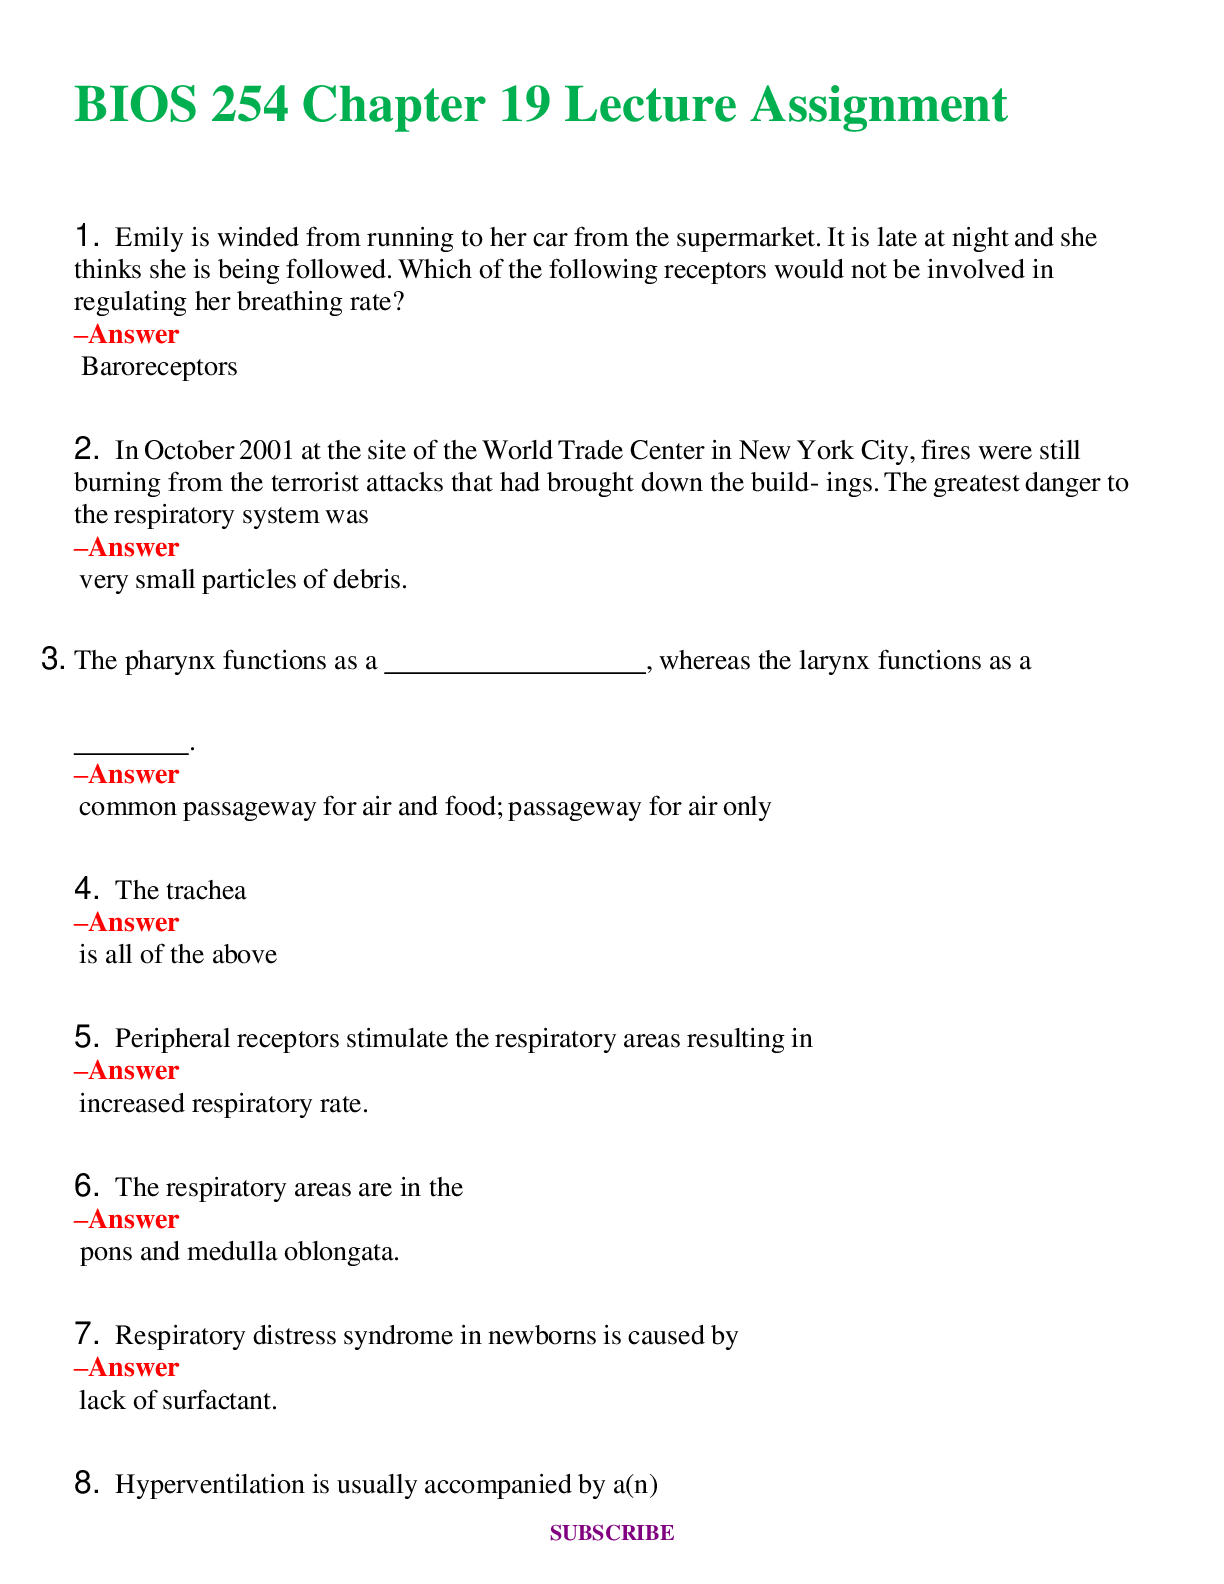
BIOS 254 Chapter 19 Lecture Assignment Questions and Answers (Verified Answers)
$ 12.5
SOLUTIONS MANUAL for Financial Management for Public Health, and Not-for-Profit Organizations 7th Edition by Steven Finkler, Thad Calabrese, (Complete 15 Chapters)
$ 25.5
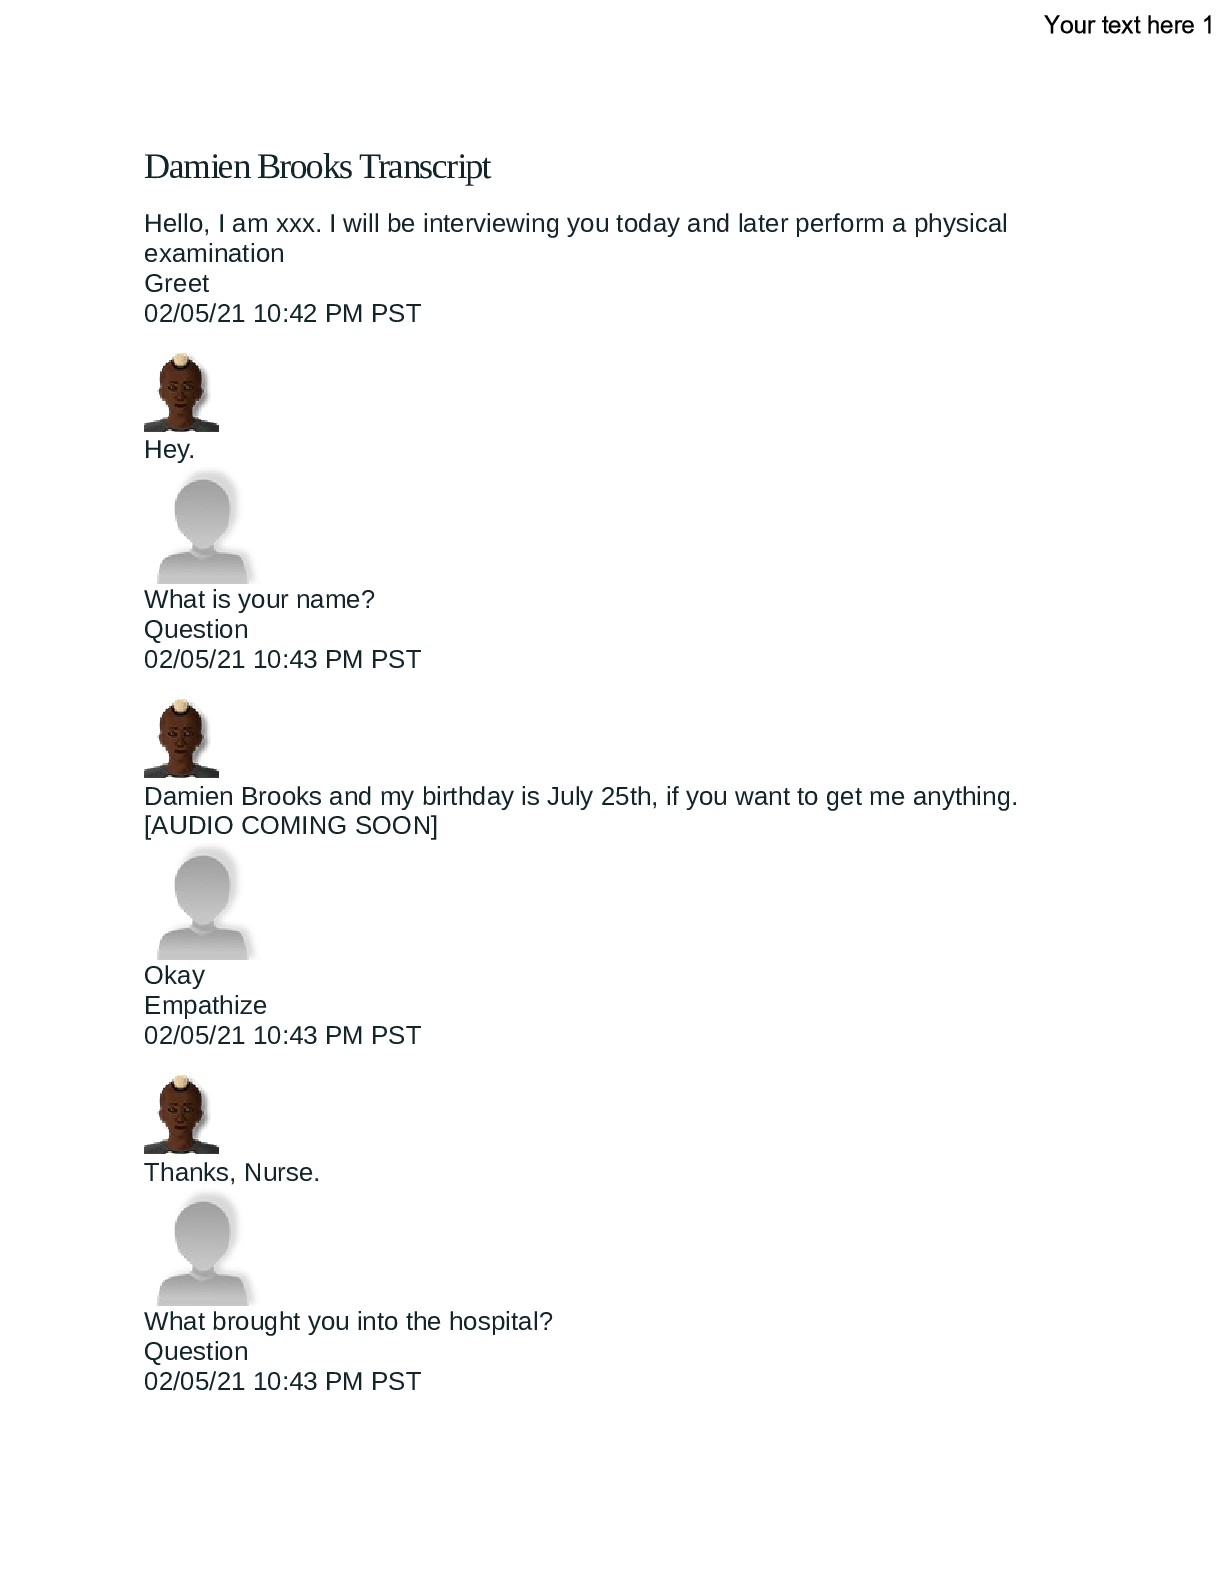
Patient Damien Brooks/Damien Brooks Transcript -Traumatic Brain Injury- Shadow Health - Pediatrics (Complete Solutions, Graded A)
$ 13
(ASU Online) BIO 440 Functional Genomics Comprehensive Midterm Exam 2 2024
$ 13

MKT.113 final submission template 9.30.20| MKT113: FinalProject Part IFinal Submiss
$ 7
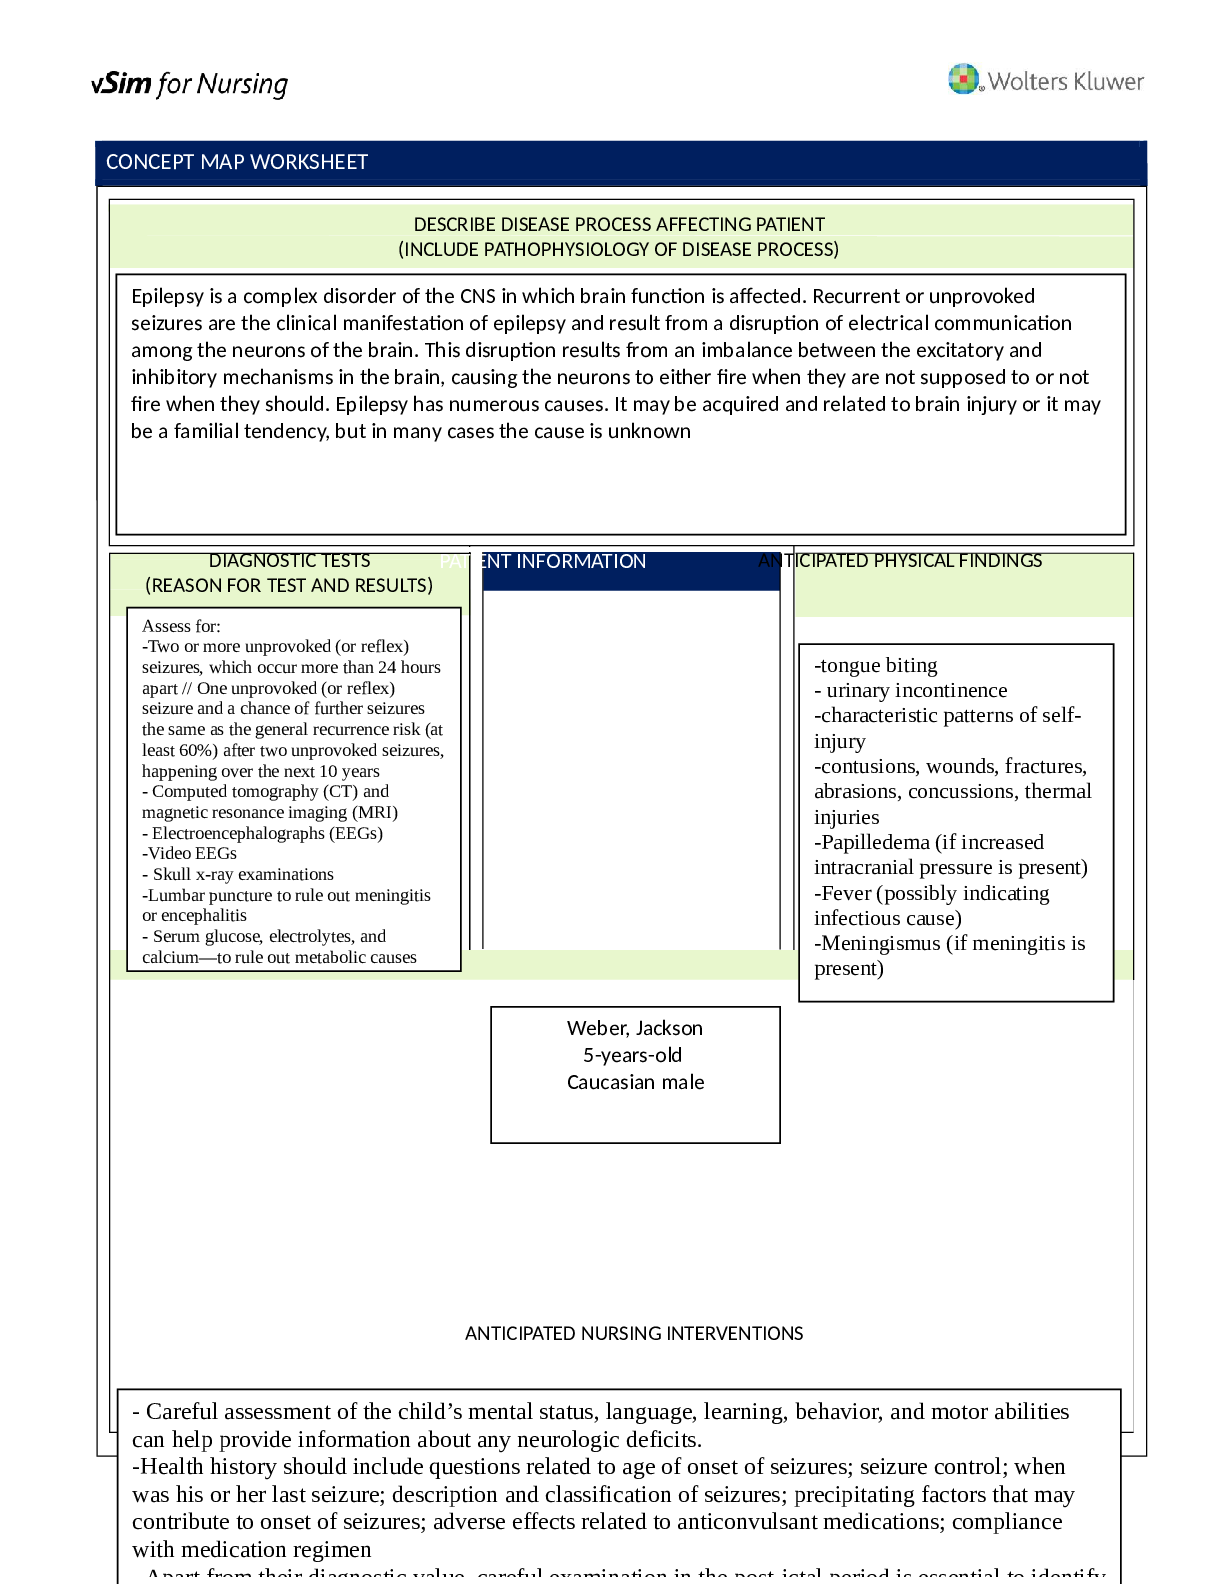
VSIM FOR NURSING_ JACKSON WEBER CASE Clinical Worksheet and Reflective Questions with Answers SOLUTIONS
$ 15
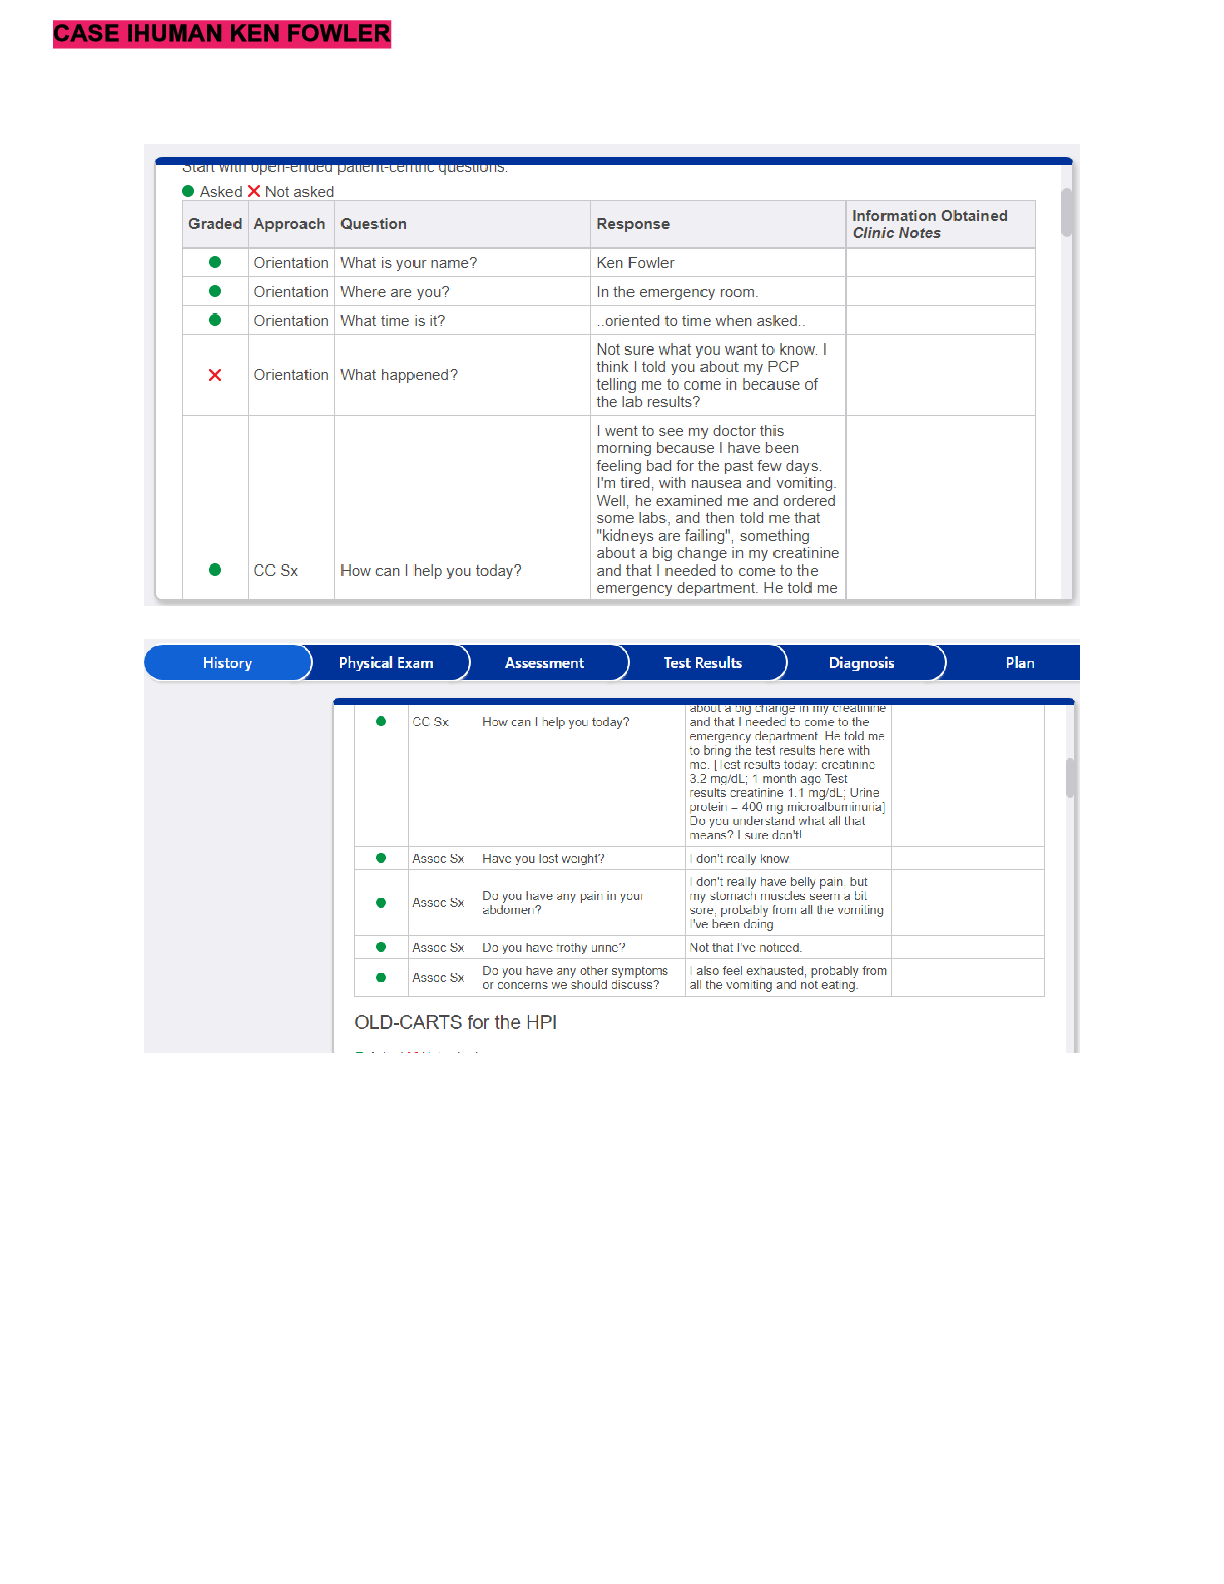
Ken Fowler IHUMAN Case Study Ken Fowler - Complete Solutions (Graded A+)
$ 14
Porth’s Pathophysiology Concepts Of Altered Health States 10th Edition By Tommie L. Norris TEST BANK
$ 28

Betty Burns, chana kumar, Carlotta A. Russe, Mabel Johnson,Patricia Doyle,Janet Riley and Justin Johnson Ihuman Cases with Complete Solutions.
$ 15
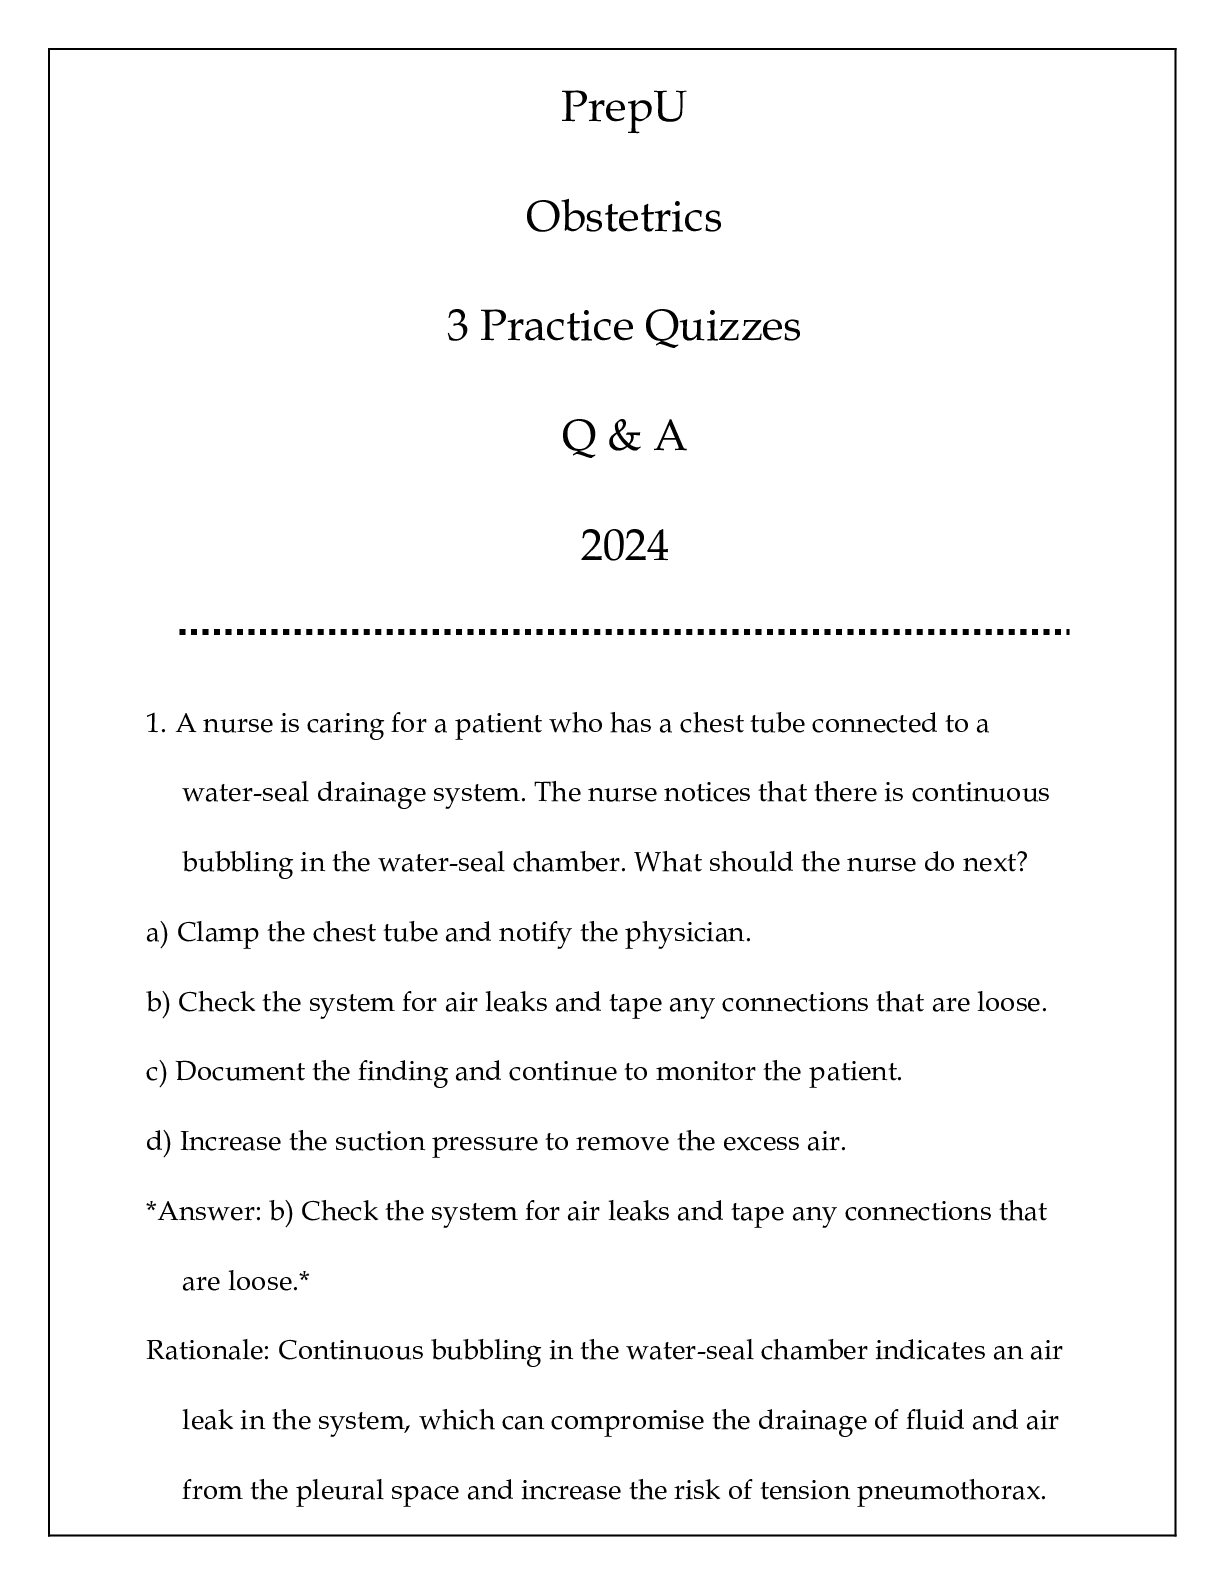
PrepU Obstetrics OB 3 Practice Quizzes Q & A 2024
$ 12

eBook Comparative Politics INTEGRATING THEORIES, METHODS, AND CASES, 3rd Edition By Tyler Dickovick, Jonathan Eastwood
$ 25

Women’s Health iHuman case: Nancy Campbell -Complete Solutions (Graded A)
$ 12
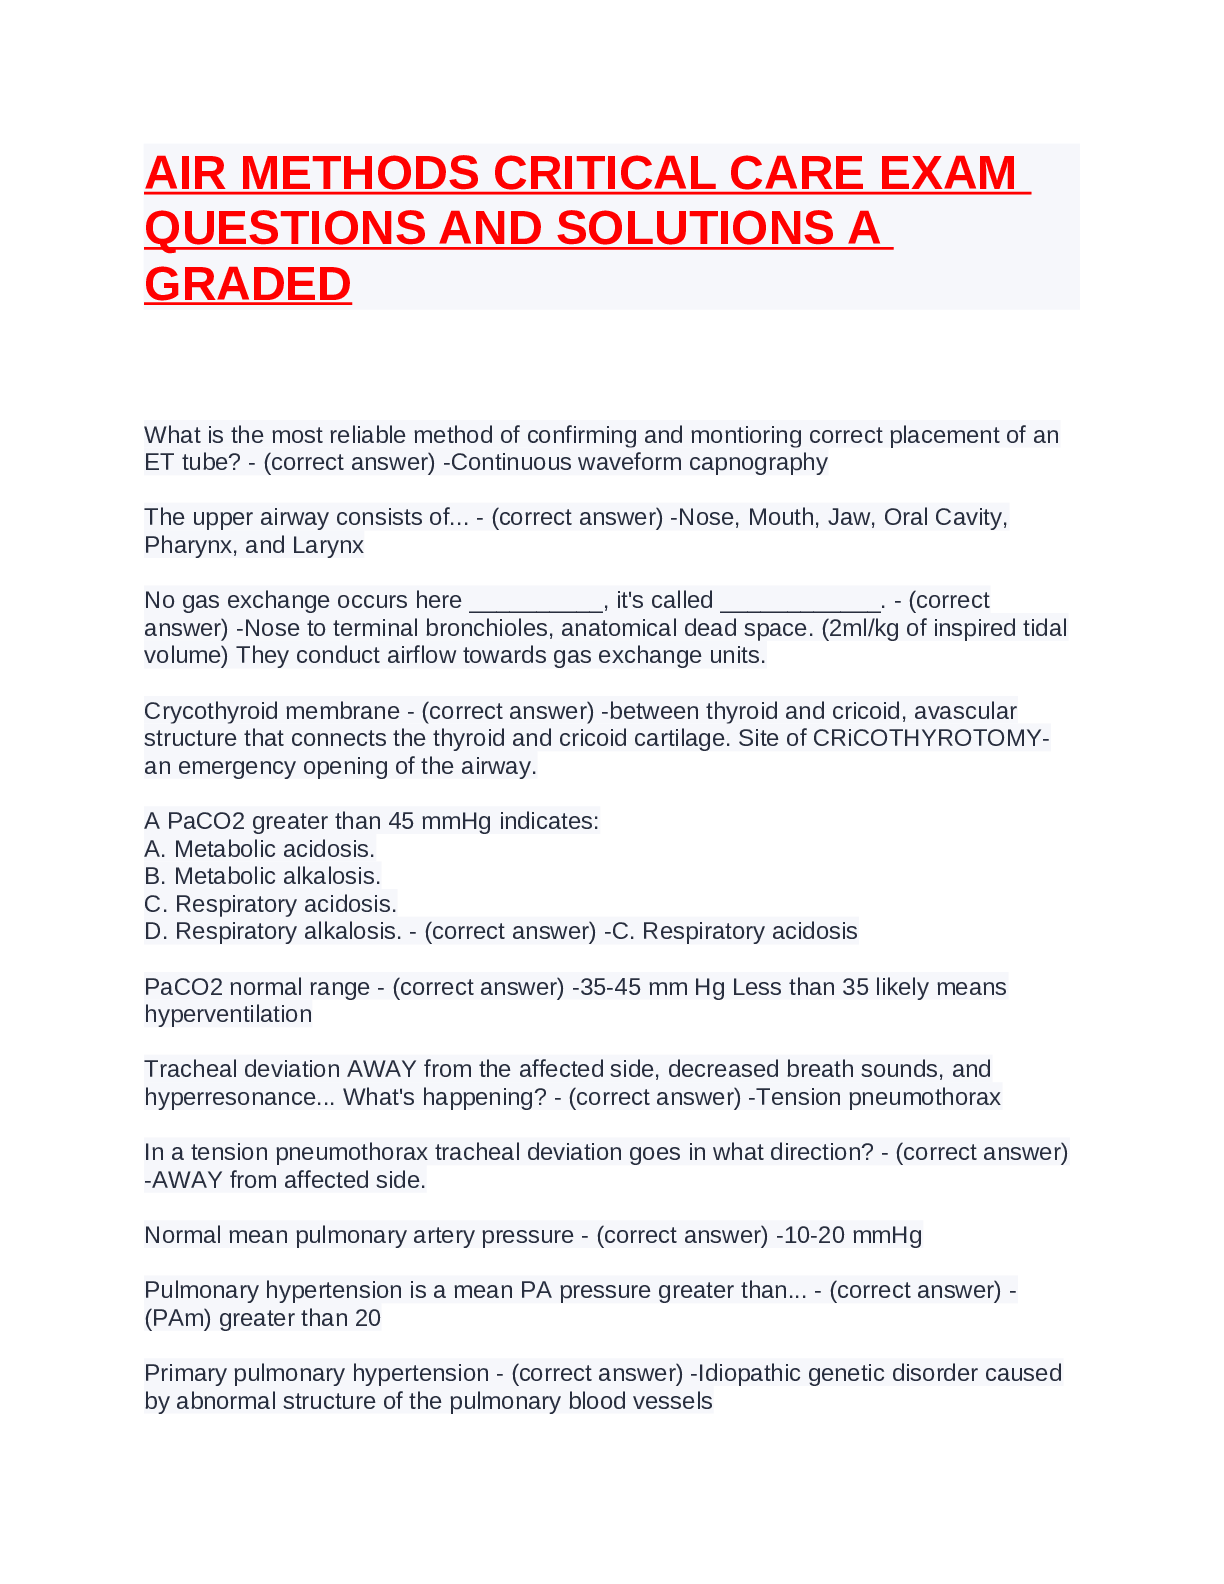
AIR METHODS CRITICAL CARE EXAM QUESTIONS AND SOLUTIONS A GRADED
$ 8
eBook [PDF] Biology The Essentials, 4th edition, By Mariëlle Hoefnagels
$ 26
eBook Elementary Algebra for College Students, 10th Edition By Allen Angel, Dennis Runde
$ 25

AQA GCSE COMBINED SCIENCE: TRILOGY Higher Tier Chemistry Paper 1 QP
$ 6

MKT113 Part 1 Final| MKT113: FinalProject Part IFinal Submission Southern New Hamp
Final Assignmen Answer_2.png)