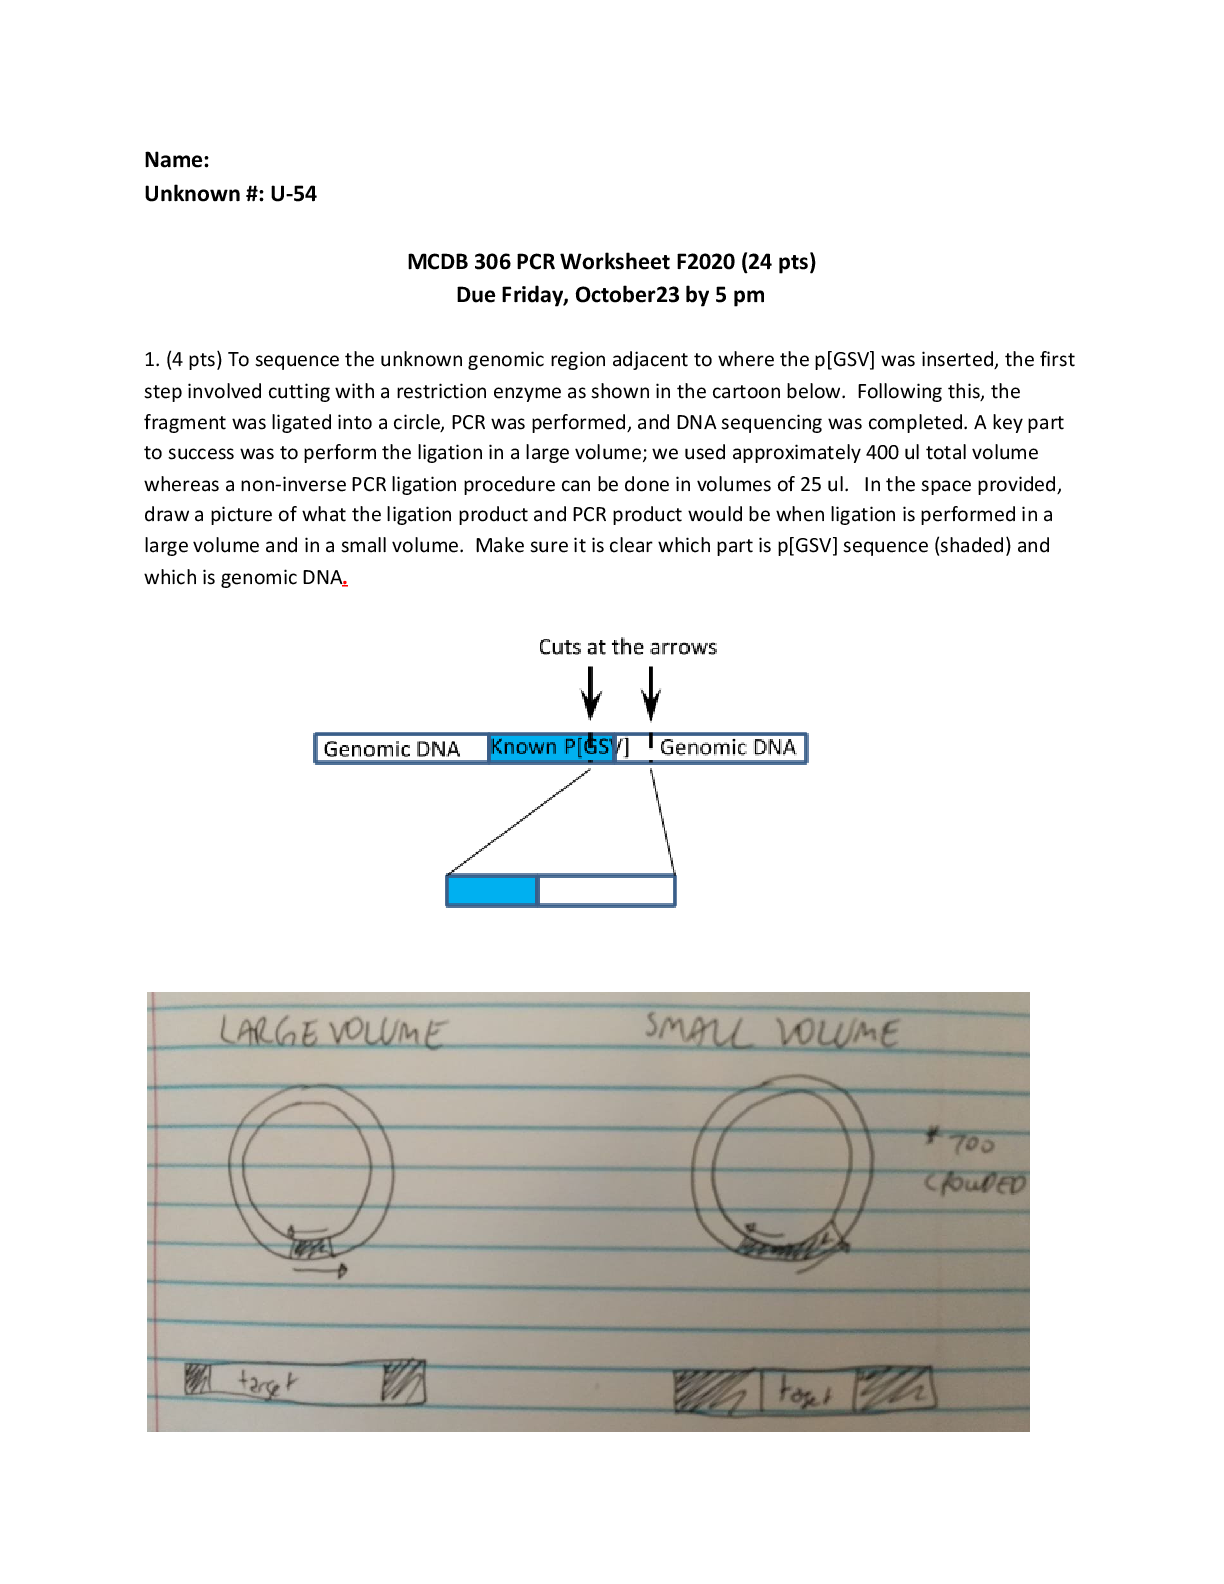
ISYE Midterm 1 Notes:
Week 1 Classification:
- Two main types of classifiers:
o Hard Classifier: A classifier that perfectly separates data into 2 (or more) correct classes.
This type of classifier is rigid and is on
...
ISYE Midterm 1 Notes:
Week 1 Classification:
- Two main types of classifiers:
o Hard Classifier: A classifier that perfectly separates data into 2 (or more) correct classes.
This type of classifier is rigid and is only applicable to perfectly separable datasets.
o Soft Classifier: A classifier that does not perfectly separate data into perfectly correct
classes. This type is used when a dataset it not realistically separable by class thus we
use a more flexible classifier that gives us not a perfect, but optimal solution given the
constraint of a-separability.
- If a given model uses a soft classifier, we can further tune it to fit our needs based on factors
such as the cost of misclassification.
- Semantics on the types of data:
o Columns: Attribute / Features / Response / Covariates / Predictor
o Rows: Observations / Data point
o Structured Data: data that is described and stored in a structured way
o Unstructured Data: data cannot be described or easily stored. The most common
example is written language.
o Quantitative Values: Numbers that have meaning in a numerical sense
o Categorical Data: can be numeric representing a category or non-numeric indicating a
category
o Unrelated Data: No relationships between datapoints
o Timeseries Data: Same data recorded over time typically in regular intervals
- Hyperplane: In a p-dimensional coordinate space, a hyperplane is the flat affine subspace of that
dimension such that it takes a dimensionality of (p-1). In this context affine indicates that the
subspace need not pass through the origin. This equation will be in general linear form.
o Equation of p dimensional general form:
β0 + β1X1 + β2X2 + … + βpXp = 0
- Linear Separable Hyperplane: Given a set of datapoints with given signed classes and perfectly
linearly separable classes, there will be an infinite number of hyperplanes equations that satisfy
all points being classified correctly. This is demonstrated in the constraints below. If a point is
above the hyperplane it will have a positive value and if it is below the separating hyperplane it
will have a value less than zero. Furthermore, if the class is correctly predicted via the result of
the equation it will share the sign of its respective yi value. Given these two properties of the
hyperplanes we can infer the following constraints.
If yi = 1; β0 + β1X1 + β2X2 + … + βpXp > 0
If yi = -1; β0 + β1X1 + β2X2 + … + βpXp < 0
o We can equivalently rewrite these two inequalities into a single property of the
hyperplane by combining them via a class wise multiplication term. This multiplication
causes no change as we have perfect sign translation without class error.
(Yi) (β0 + β1X1 + β2X2 + … + βpXp) > 0
o The above equation/constraint verifies that all points are properly classified.
o There will be many linear equations that satisfy this equation, but we need to thin this
solution space down. Thus, in order to select the best one, we need to refine theoptimization problem constraints to find the optimal hyperplane that separates the
classes by the maximum amount which we will call margin.
- Margin: In the case of SVM, we define margin as the distance between the classes and their
decision boundary. Consider the previous equation for a hyperplane and consider it has 2
parallel lines equidistant from one another via a distance M. This distance M can be calculated
using the formula for the distance between parallel line:
o M = 2 / (sqrt (∑ ai2))
o In this case we are going to expand the margin as much as possible so that there is
maximum separation between classes. This optimization is gone about by minimizing the
denominator of M which is the sum of all coefficients squared. By minimizing the sum of
coefficients, we can maximize the distance between classes while our previous
constraint continues to enforce that all classes are still correctly classified. This will yield
a maximum margin classifier.
- Maximal Margin Classifier: The hyperplane that optimal separates the points into the correct
classes with the greatest margin between the decision boundary:
o Maximize: Margin~ M ~ 2 / (sqrt (∑ ai2))
o By Minimizing: ∑ ai2
o Or by setting a constraint: ∑ ai2 = 1
o Constrained by: (Yi) (β0 + β1X1 + β2X2 + … + βpXp) ≥ M
o Collectively, this optimization problem lays out that all points be classified correctly with
enough distance from misclassification as specified by the margin amount that satisfies
the inequality relative to its maximized magnitude.
o The points that lie upon the margin equations are support vectors and are equal to the
margin that has been maximized.
- Support Vector Machine: In this variant of a maximal margin classifier, we face a dataset with
non-linearly separable classes. Due to this fact we must allow violations of both the response
and the margin. We assign a cost value to each type of error and optimize the equation to the
following:
o Minimize: Λ * ∑ max {0, 1 – (∑ aixij + a0) (yi)} + λ ∑ ai2
o Λ a term multiplied by the classification error (larger if misclassification more costly)
o Λ a term multiplied by the margin magnitude (large if margin violations more costly)
o The first term quantifies the magnitude if any of the classification errors
o The second term quantifies the cost of margin violation via the lambda term
o Thus, a small lambda makes margin violations less impactful leaving more budget for
errors in the classification error term as a margin violation is less costly.
o On the other hand, a large lambda leaves little room for the classification error term and
instead prioritizes maximal margin as a violation is more costly.
o The total error will be equal to C also considered a budget of error.
o In SVM C is our cost tuning parameter that caps the sum of error terms to a desired
budget.
o This concept can be driven beyond linear decision boundaries and into a non-linear
decision boundary which is accomplished via the implementation of kernel functions
which use matrix multiplication operations to expand the given feature space into higherorder dimensions and terms. Examples include RBF dot (radial kernel) or polydot
(polynomial expansion kernel)
- SVM usually requires data adjustment operation otherwise differences in factor magnitude
values could be detrimental to model interpretation and cost optimization. Most used method of
accounting for this is scaling global making all coefficients interpreted in the same fashion.
- Scaling: a data adjustment taking a feature from one range to another interval such as 0 to 1 or
min to max scaling:
o Min – Max Scaling:
o Xij scaled = (xij – xmin j) / (xmax j – xmin j)
- Standardizing: scaling a feature or dataset by a normal distribution. This typically involves taking
the mean and standard deviation of all observations of a factor then standardizing each value by
the mean and standard deviation in the observed factor distribution
o Xij standardized = (xij – mean(xj)) / σj
o This type of standardization is commonly used with mean=0 and standard deviation = 1.
- Use cases for each form of data scaling:
o Scaling: For some models it is important for your data to be within a bounded range for
practical purposes. Such an example might be an SAT score, Batting Average, or RGB
color intensities. Additionally, some models require this such as neural networks or
optimization models (otherwise gradient will not converge)
o Standardization: Principal component analysis and clustering often perform better when
standardized rather than scaled. However, this conclusion is not universal there is much
interplay between when and how either could be used
o In most cases either method can be used and justified, and one may perform better than
another under different models etc. Try both and see what is best.
- K-Nearest Neighbor Model (KNN): this type of model is used in classification tasks that require
the classification of more than 2 classes. The model predicts the class of a new point by
determining which of a “k” number of neighbors is most numerous and this point is assigned the
mode of these neighbors. There are however multiple ways of determining which points are
closest to our test point beyond typical Euclidean straight-line distance. Sometimes, we may
have a large feature space in which we use a multidimensional distance metric that weighs the
distance in each dimension via importance. Such weights can be established through variable
selection methods such as regression, lasso, ridge, elastic nets, and PCA. The number “k” is a
tuning parameter used to determine the number of neighbors to rely on. In a suitable large
model, we often test multiple values of “k” via an elbow plot. These values range from 2 to the
root of n datapoints. The use of root n as our maximum value of “k” is a common heuristic.
Week 2 Validation:
- Validation: The process of testing how good a model truly is by exposing it to out of sample data
and discovering objectively how it performs outside of training.
- In data science, you cannot train a model on the same data set you use to measure its
performance. Otherwise we would provide an inaccurate model with a misleadingly high
accuracy level.
- In the training of a model on a given dataset we see two types of effects taken into account:o Real Effects: true relationships observed by the model present in the data and capable of
describing and predicting events outside its sample
o Random Effects: Things noticed in the sample data that appear real but are in fact just
noise from the training dataset. When taken beyond our sample these effects will
provide misleading results and perform poorly if they comprise a significant amount of
the model’s predictive ability.
- By validating with outside data, we introduce our model to a new set of data with its own
random effects that will differ heavily from the random effects of the first data set. Thus, a model
with a good ability to predict will be concentrated with capturing real effect thus if performance
is consistent across datasets with varying random effects it is likely to have captured more real
dataset properties and effects than other models.
- Train, Validate, & Test Approach:
o Use 70% of randomly sampled data for training the model
o Ranges from: 70%-90% train 10%-30% testing/validation
o Use 30% of held out data to randomly assign a validation and test set of data both 15%
o Train multiple models on the training dataset
o Compare the performance of these models on the validation set
o Select the best model from the validation dataset
o Run the chosen validation model against the test dataset and get our true model
performance estimate which will be impartial
- It is notable that when validating models, the performance of each model will differ somewhat
due to randomness. In some cases, models may be totally equal in true quality, but due to
randomness some will be better in accuracy measure and some worse
- This is the reason that although we choose the highest performance model on the validation set,
we must acknowledge that this model chosen is most likely to have an edge on the other models
just because of randomness. However, it could also be real effect we have no idea to tell. So then
we bring in the third test set and use this as our true estimation of performance and don’t look
back at the other models.
- Data Splitting Methods:
o Random splitting via percentage: Could lose some segmentation qualities of the dataset
that would help in prediction. However, does not introduce any new bias.
o Rotation assignment: This allows equal assignment in part of segments such as if we
dealt with timeseries. However, we may inevitably create another form of bias via this
type of methodic assignment.
- Cross-Validation: A hybrid of validation model that improves on the short comings of splitting
methods. This method discussion is called “k” fold cross-validation. We break up the dataset up
into “k” parts or folds. For each of our “k” folds we train the model on all but one-fold and test
on the left our fold. We continue this process until the model has been trained on all folds (k-1)
times and been a test set 1 time. We then average these k valuations of validation accuracy to
come up with a generally acceptable model accuracy. No steadfast number for the number of
“k” folds however, 10 is common.
- For each fold of cross validation, we get a slightly different classifier. We should not attempt to
average all these results instead we choose our best one then run that given model on the entire
dataset and test its performance.Week 2 Clustering:
- Clustering: taking a set of datapoints and breaking them up on to similar groups
- Clustering is often useful in target marketing in order to segment the market by attribute then
market depending on the attributes of a group.
- Often used in initial data analysis where if we can quickly group data such as documents into
clusters, we can further investigate each cluster with differences in mind although we will need
to find an explanation for this meaning.
- Determining the number of clusters or the determination of clusters can be subjective and
depends heavily on the chosen distance metric chosen to optimize the model against.
o Rectilinear Distance (Manhattan Distance) (single-norm distance):
|x1 – y1| + |x2 – y2|
o Euclidean Distance (2-norm distance):
Sqrt{(x1 – y1)2 + (x2 – y2)2}
o P-Norm distance (Generalization/Extension of both) (Makowski Distance):
Pth root of {|x1 – y1|p + |x2 – y2|p}
Extending dimensionality: Pth root of {∑|x1 – y1|p + |x2 – y2|p}
o Generalizing to the infinity power: since each of the terms is raised to an equally infinite
power the only differentiator would be the term with the largest sum/difference as once
it is raised to the infinity power will swap all other terms and dominate the vast majority
of all the normed distance. Because we know that the root and power are the same
(infinity) we can cancel them, and we are left with simply:
|xi – yi|
o Deceptively simple No? Simply means the largest set of distance pairs.
o The infinity norm has some practical applications for example consider a warehouse with
an automated storage retrieval system. How can we measure the time it takes to extend
all its hands and parts as well as motion to retrieve the box? Some of these processes
can be operated simultaneously thus the true length of time retrieval takes is merely the
step that takes the longest amount of time.
- K-means: an unsupervised heuristic clustering algorithm that initialized random or specified
centroids or cluster centers. The algorithm then goes through and assigns each point to the
cluster nearest a given center given a distance metric. Quite a hard optimization problem to
solve as it is an integer program at least in the context of finding a global solution. The number
of cluster “k” is user defined and chosen parameter. Once all points are assigned to randomly
initialized centers, we recalculate the cluster centers based on new point assignments and keep
repeating this process until no data points change cluster assignment. The algorithm relies on
expectation management or EM.
- A heuristic algorithm like K-means is not likely to find the global optimized solution instead it will
yield a local maximum/minimum that will not be the true best solution but will be reasonably
good.
- In practice we use the K-means clustering against many values of “k” with an elbow diagram
showing fit (total intra-cluster distance) via k value and choose the point of the elbow or where
the rate of accuracy change significantly changes.- Outlier removal can be very important or situational in such a clustering model as it will
significantly alter the mean of its assigned cluster potential distorting the model clusters.
However, this outlier could also be important in recognizing the true extent of a cluster.
- In assigning new data points to clusters we can simply map the bounds of cluster center
closeness to identify the assignment cluster of any new data point. Such a diagram is known as
the Voronoi diagram.
- Supervised Learning: We known the attributes and correct labels of the input or training data
these methods are usually more common in analytics
- Un-supervised Learning: We have no labels for the input data only the attributes of the data less
common but often used in feature engineering and or initial data exploration.
Week 3 Basic Data Preparation:
- When using a dataset with multiple features with differing scales and or magnitudes it is often
best to scale and standardize these problems
- Often there is missing data in a dataset or outliers that require unique use cases depending on
the situation
- Outlier: a datapoint that is significantly different from the rest of the dataset often known as a
point outlier. However, we can have grouped outliers meaning a small cluster of points that take
vastly different values from the rest of the dataset.
- Contextual Outlier: often a value maybe of a regular value but in something like a time series it
may appear an outlier due to irregular timing
- Collective Outlier: A group of values that collectively look like an outlier such as a missing
heartbeat in a consistent pattern
- Box and whisker plots are effective tools to identify the characteristics of the data In 2
dimensions
- Alternatively, in multidimensional datasets we could fit a model to it and analyze error terms
that are significantly large in magnitude compared to the fit model’s typical error.
- Sometimes outliers occur due to sensor malfunction or incorrectly entered data in which case
the point should be removed or use imputation techniques.
- Other times outliers show something real in the system where they need to be further
investigated to see if it is reasonable to keep it in the model.
- In dealing with large datasets a true distribution allows for outlier points does it fit these
distributions reasonably expect size and frequency of these distributions? This can be tested
using outlier tests of removal covered later.
- Sometimes we separate out all the model’s outlier and structure independent models around
such outlier conditions or tail events.
[Show More]